Figure 3. Impact of VAP-1 blockade on macrophage infiltration in CNV. A–F: Representative micrographs of F4/80 immunostaining in CNV lesions from an animal treated with vehicle or VAP-1 inhibitor.
(Left) CNV lesions stained for PECAM-1. (Middle) Immunofluorescence staining for F4/80. (Right) Merged image. G: Quantitative analysis of F4/80-positive cells in CNV lesion. Bars show the average of the number of infiltrated macrophages
in each group. Values are mean±SEM (n=3 to 4). *, p<0.05. H: Quantitative real-time PCR analysis of F4/80 expression in animals treated with vehicle or VAP-1 inhibitor (n=9 to 10).
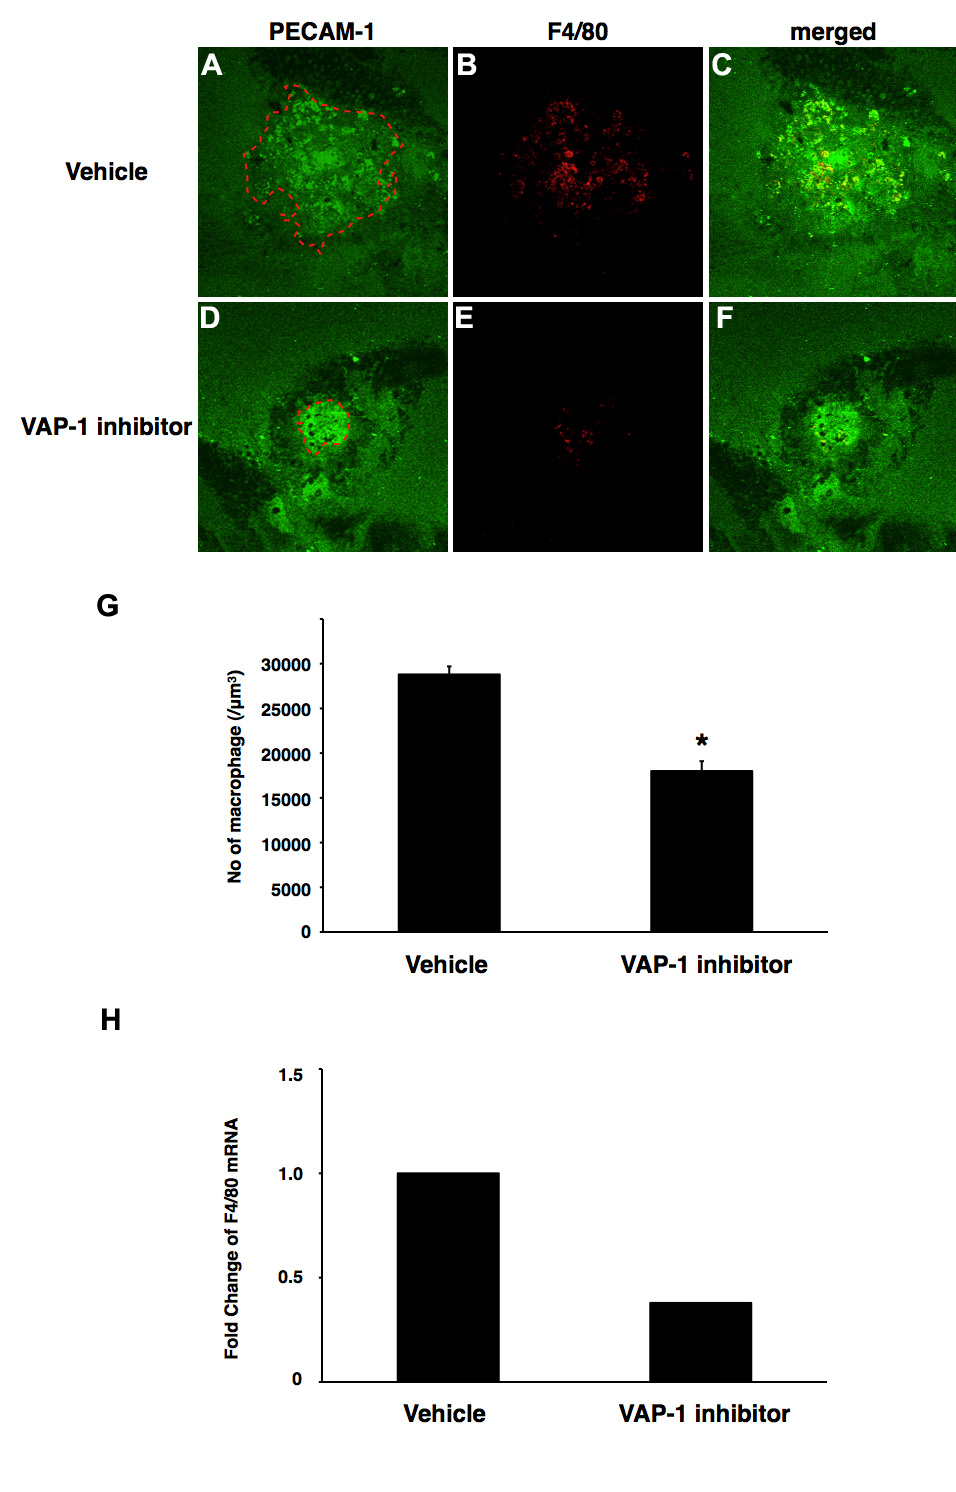
 Figure 3 of
Yoshikawa, Mol Vis 2012; 18:593-600.
Figure 3 of
Yoshikawa, Mol Vis 2012; 18:593-600.