Figure 2. Impact of VAP-1 blockade on CNV formation. A and B: Representative micrographs of CNV lesions in the choroidal flatmounts from an animal treated with vehicle or VAP-1 inhibitor.
Red dashed line shows the extent of the CNV lesions stained with FITC-conjugated isolectin B4 in flatmounted choroids. C: Quantitative analysis of CNV size. Bars show the average CNV size in each group. Values are mean±SEM (n=9 to 10). *, p<0.05
**, p<0.01.
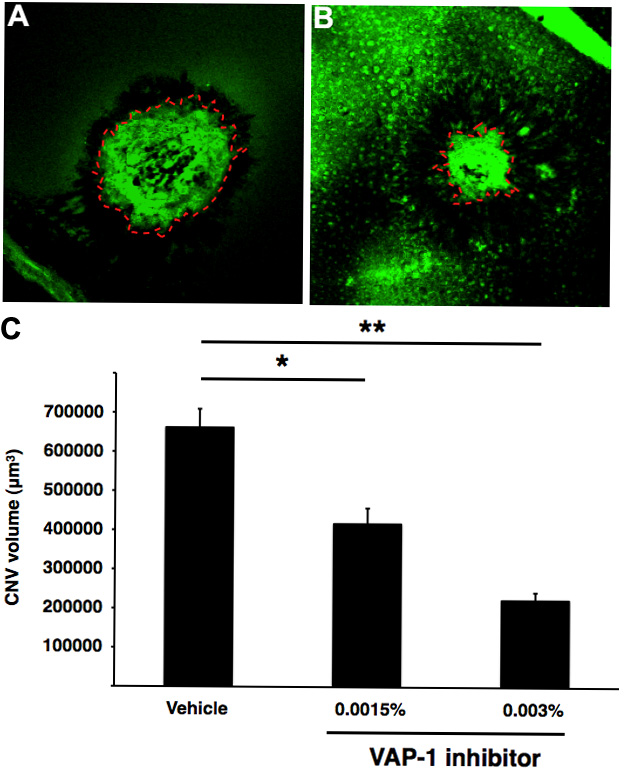
 Figure 2 of
Yoshikawa, Mol Vis 2012; 18:593-600.
Figure 2 of
Yoshikawa, Mol Vis 2012; 18:593-600.