Figure 5. ZO1 (red) and N-cadherin
(green) staining patterns in UCB1 MSCs incubated in three
different culture media. Images in A-C show ZO1
staining alone, while images D-F show an overlay
of the ZO1 and TO-PRO-3 (blue) staining, so individual cells can
be observed. Images G-I show N-cadherin staining
alone, while images J-L show an overlay of the
N-cadherin and TO-PRO-3 staining. Images M and N
are negative controls showing overlays of the rhodamine and
TO-PRO-3 channels (M), and FITC and TO-PRO-3 channels (N).
Original magnification: 40×.
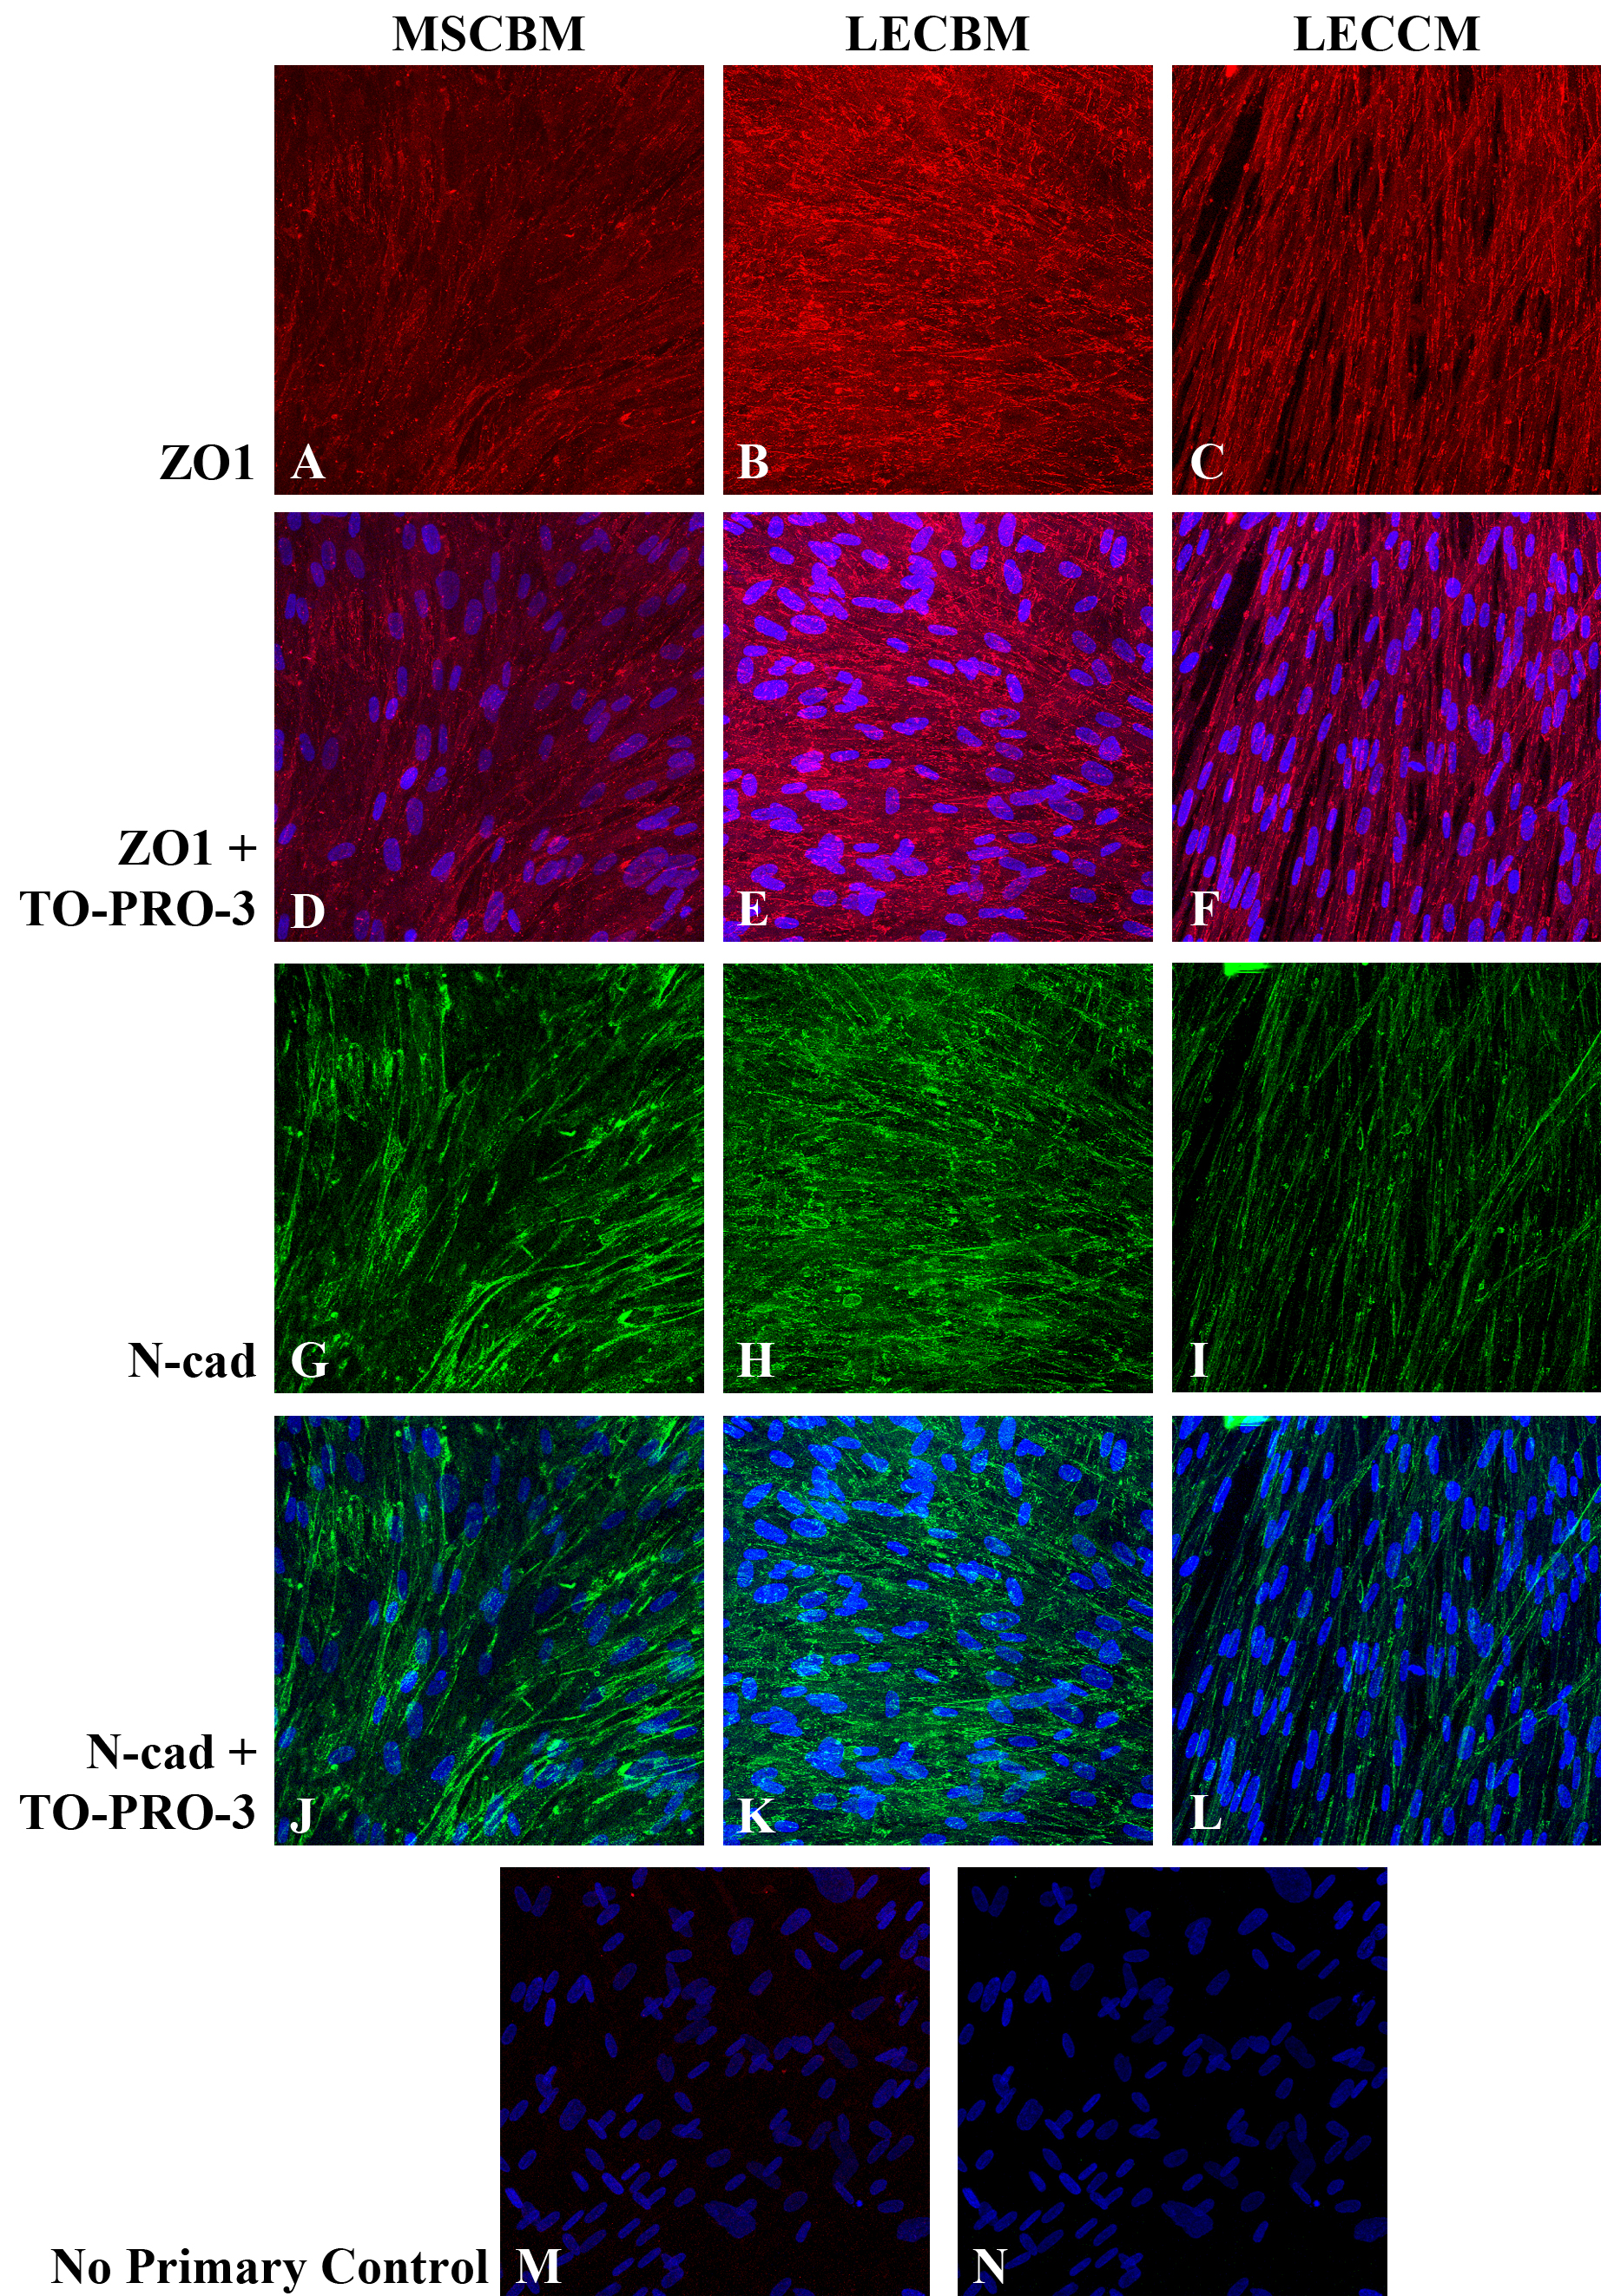
 Figure 5
of Joyce, Mol Vis 2012; 18:547-564.
Figure 5
of Joyce, Mol Vis 2012; 18:547-564.