Figure 3. Quantitative real-time PCR confirms differences in gene expression identified by microarray analysis in UCB1, UCB4, and HCEC.
Relative expression levels were normalized to the housekeeping gene GAPDH and are shown relative to the highest value (0 to 1). Error bars represent one standard deviation for the four UCB (two UCB1
and two UCB4) and six HCEC biologic replicates tested. Robust multi-array average (RMA) estimated expression levels from the
Affymetrix array, averaged for the biologic replicates within each cell type, are listed on the x-axis.
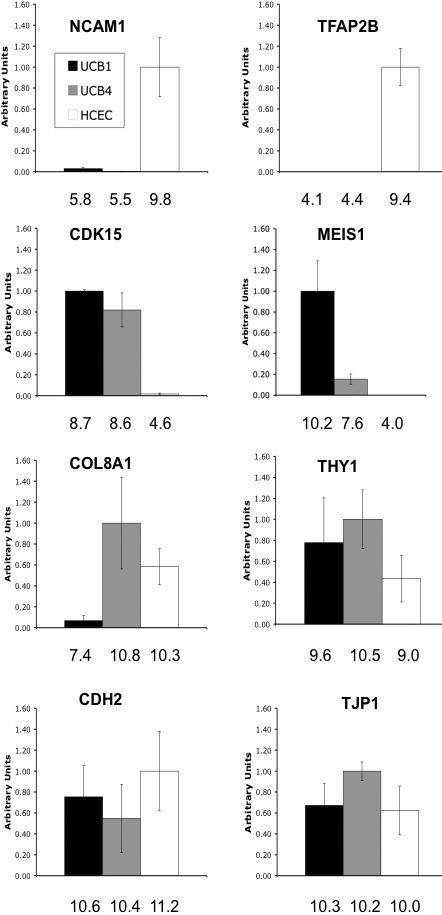
 Figure 3 of
Joyce, Mol Vis 2012; 18:547-564.
Figure 3 of
Joyce, Mol Vis 2012; 18:547-564.