Figure 2. Cluster dendrogram and heat
map results. Cluster dendrogram (A) shows relationships
in gene expression among UCB1, UCB4, young HCEC, and older HCEC
samples. The heatmap in (B) shows relative levels of gene
expression at a p-value of 0.001 between UCB1 and UCB4 MSCs and
HCECs from young and older donors. The relative levels of gene
expression are depicted using a color scale where red represents
the lowest and green represents the highest level of expression.
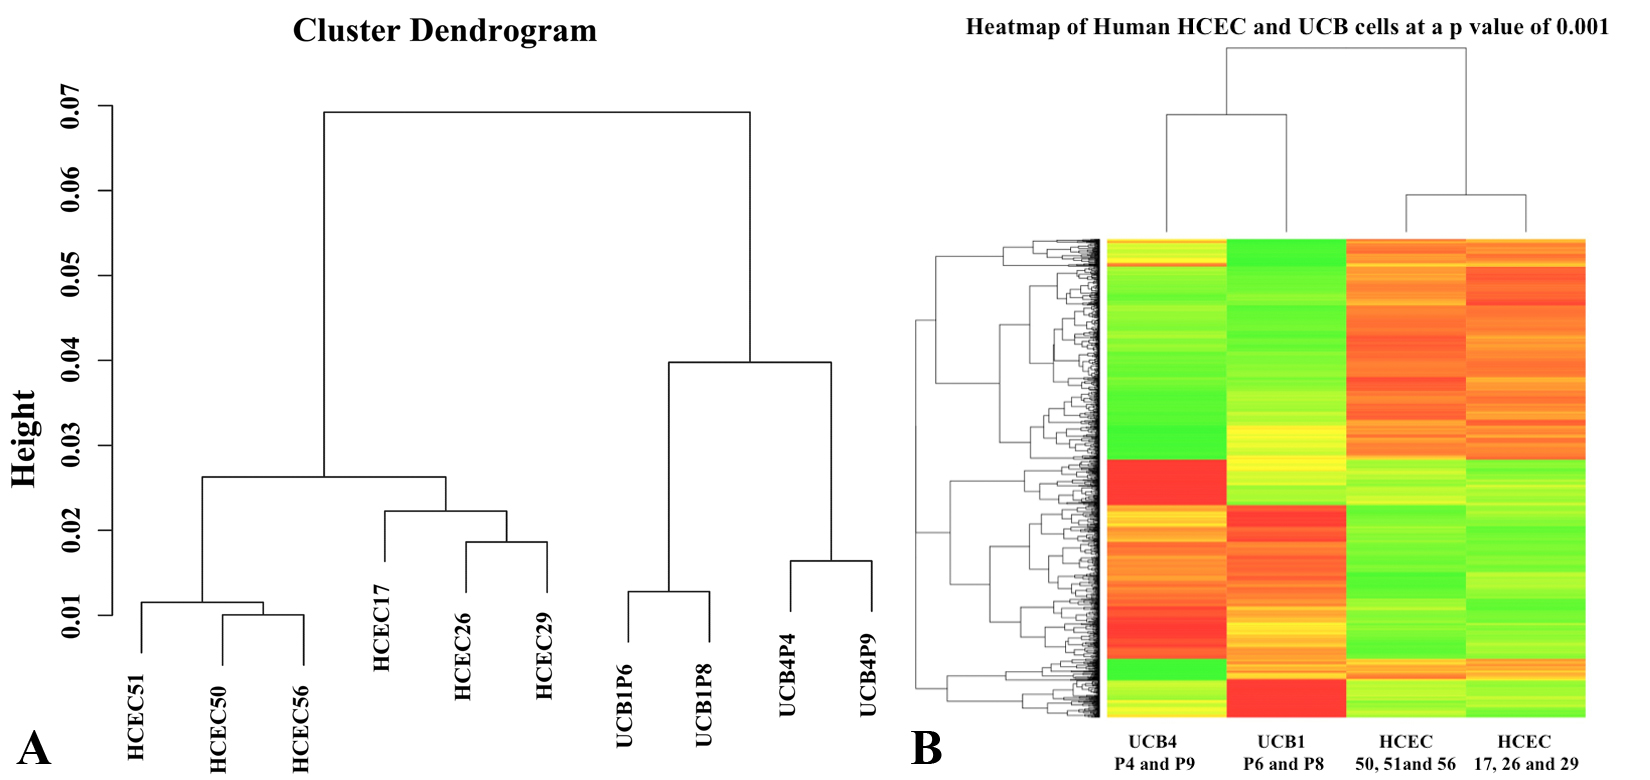
 Figure 2
of Joyce, Mol Vis 2012; 18:547-564.
Figure 2
of Joyce, Mol Vis 2012; 18:547-564.