Figure 5. Identification of a novel
heterozygous deletion containing the SAG exon 2 in the
patient with Oguchi’s disease. A: Schematic
representation of the identification of the intragenic deletion
containing SAG exon 2 with the translation start site
(ATG). Top: the location of primer pairs (In1, In2–1, In2–2,
In2–3, In2–4, and In2–5) used in the quantitative PCR for fine
mapping the breakpoints of the deletion in the region between
intron 1 and exon 3. The deleted part of the SAG gene is
shown with the dashed line. Bottom: the location of the primer
pairs (In1-F and In2–4-R) used in long-range PCR. Boxes are
exons with the coding region indicated in black and the
5′-untranslated region in white. The exons and introns are not
drawn to scale. B: Gel analysis of the long-range PCR
products. C: Chromatograms showing the breakpoints of
the intragenic deletion.
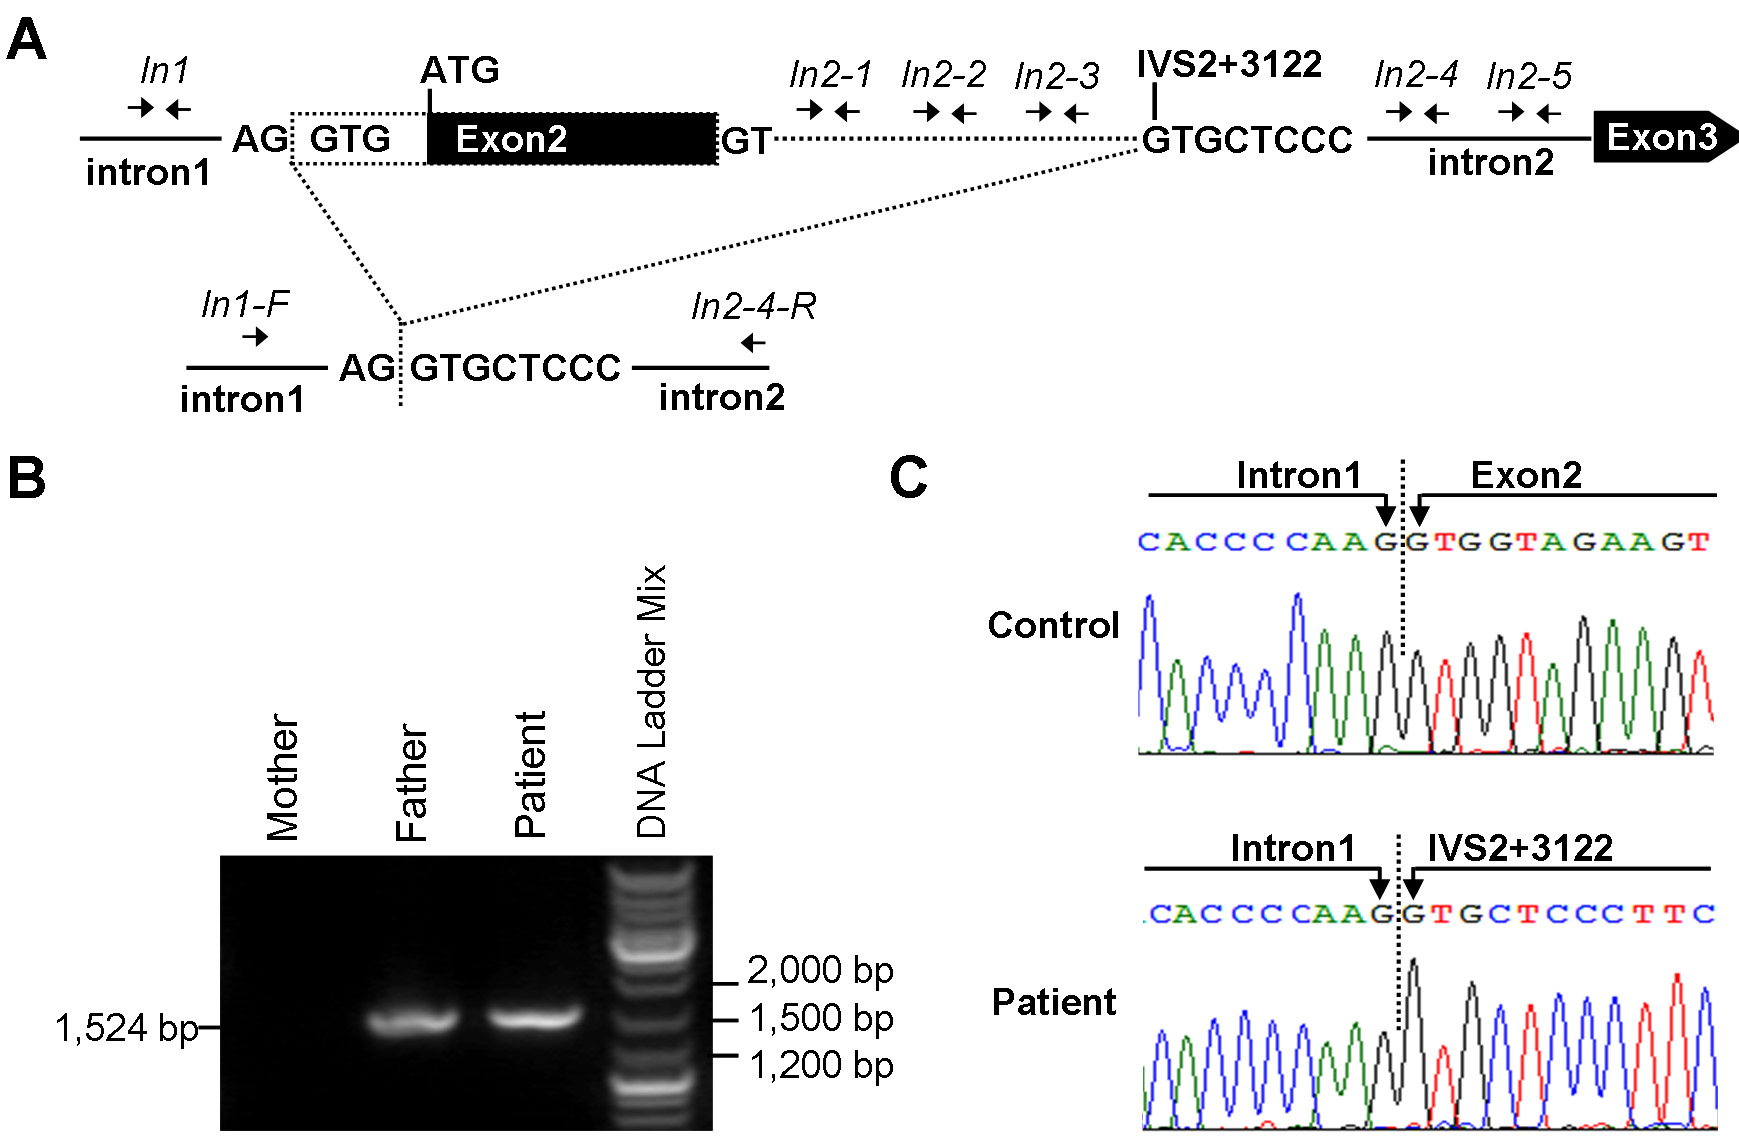
 Figure 5
of Huang, Mol Vis 2012; 18:528-536.
Figure 5
of Huang, Mol Vis 2012; 18:528-536.