Figure 1. Linkage disequilibrium plot of nine SNPs in IL10 SNPs in 598 study participants. The D’ value and r2 value (in parentheses) corresponding to each SNP pair are expressed as a percentage and shown within the respective square.
Higher D’ is indicated by a brighter red. The 9 SNPs constitute a haplotype block spanning 3.2 kb of IL10.
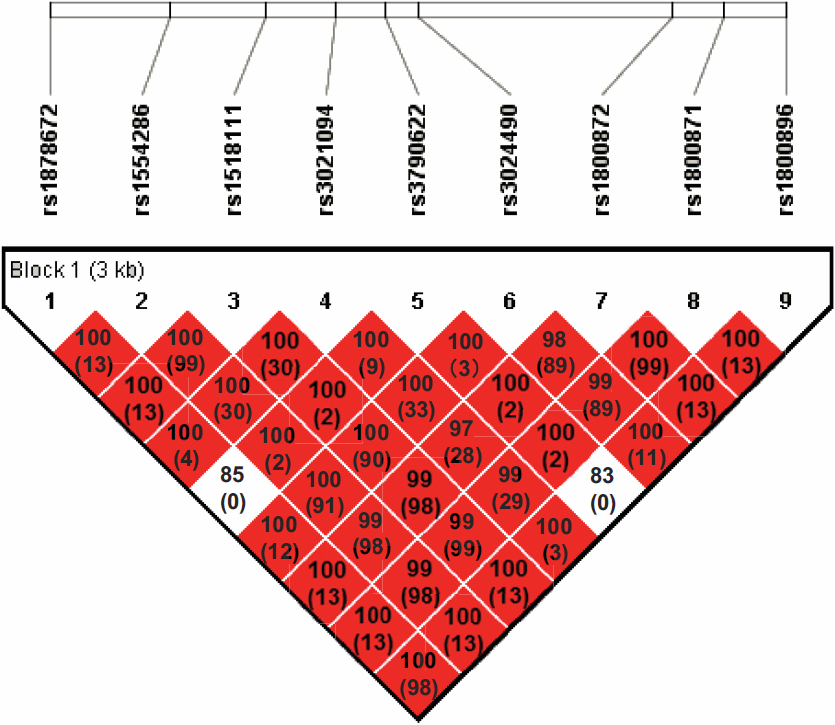
 Figure 1 of
Sakuyama, Mol Vis 2012; 18:512-518.
Figure 1 of
Sakuyama, Mol Vis 2012; 18:512-518.