Figure 3. Protein carbonyl content in soluble protein fraction of WNIN/Ob (top panel) and WNIN/GR-Ob rats (bottom panel) at different
ages. Data are mean±SE (n=6). The asterisk (*) above the bars denotes that data are significantly different between lean and
obese rats at the respective age.
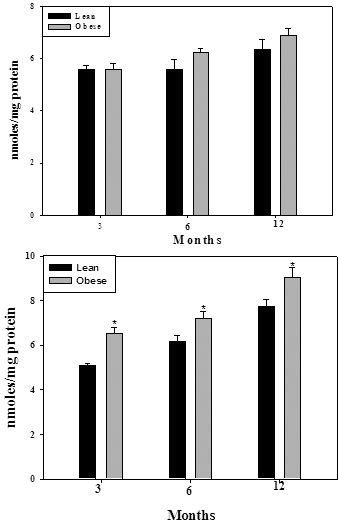
 Figure 3 of
Reddy, Mol Vis 2012; 18:495-503.
Figure 3 of
Reddy, Mol Vis 2012; 18:495-503.