Figure 1. Profile of crystallin distribution in WNIN/Ob rat lens. Representative distribution profile of eye lens crystallins in soluble
fraction of lean and WNIN/Ob rats. Soluble protein (20 μl, 1 mg/ml in equilibration buffer) was loaded on TSK-G3000 SWXL gel
filtration column and protein peaks were detected at 280 nm with a flow rate of 1 ml/min. Peaks representing alpha (α-), betaH
(βH-), betaL (βL-), and gamma (γ-) crystallin, and high molecular weight (HMW) fractions are indicated at their respective
positions.
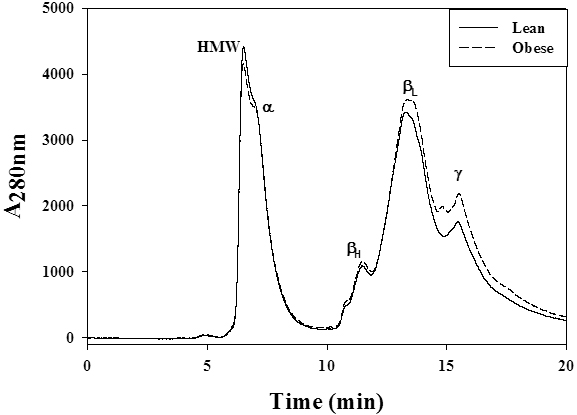
 Figure 1 of
Reddy, Mol Vis 2012; 18:495-503.
Figure 1 of
Reddy, Mol Vis 2012; 18:495-503.