Figure 1. Relative FGF2 mRNA
level in FDM, fellow and normal eyes. The expression levels of
FDM eye (n=14) and fellow eye (n=14) were significantly higher
than normal eye (n=13, the averaged data from both eyes was used
for each animal; p=0.00004 and 0.0027, respectively). The
expression level of FDM eye was also higher than the fellow eye
(p=0.0334). The expression level of normal eye was the
expression level of right (n=13) eyes of normal control guinea
pigs. The test of significance in comparing FDM and fellow eyes
was using paired-t statistics, and unpaired t-test for
the comparison between eyes of normal controls and eyes of form
deprivation group.
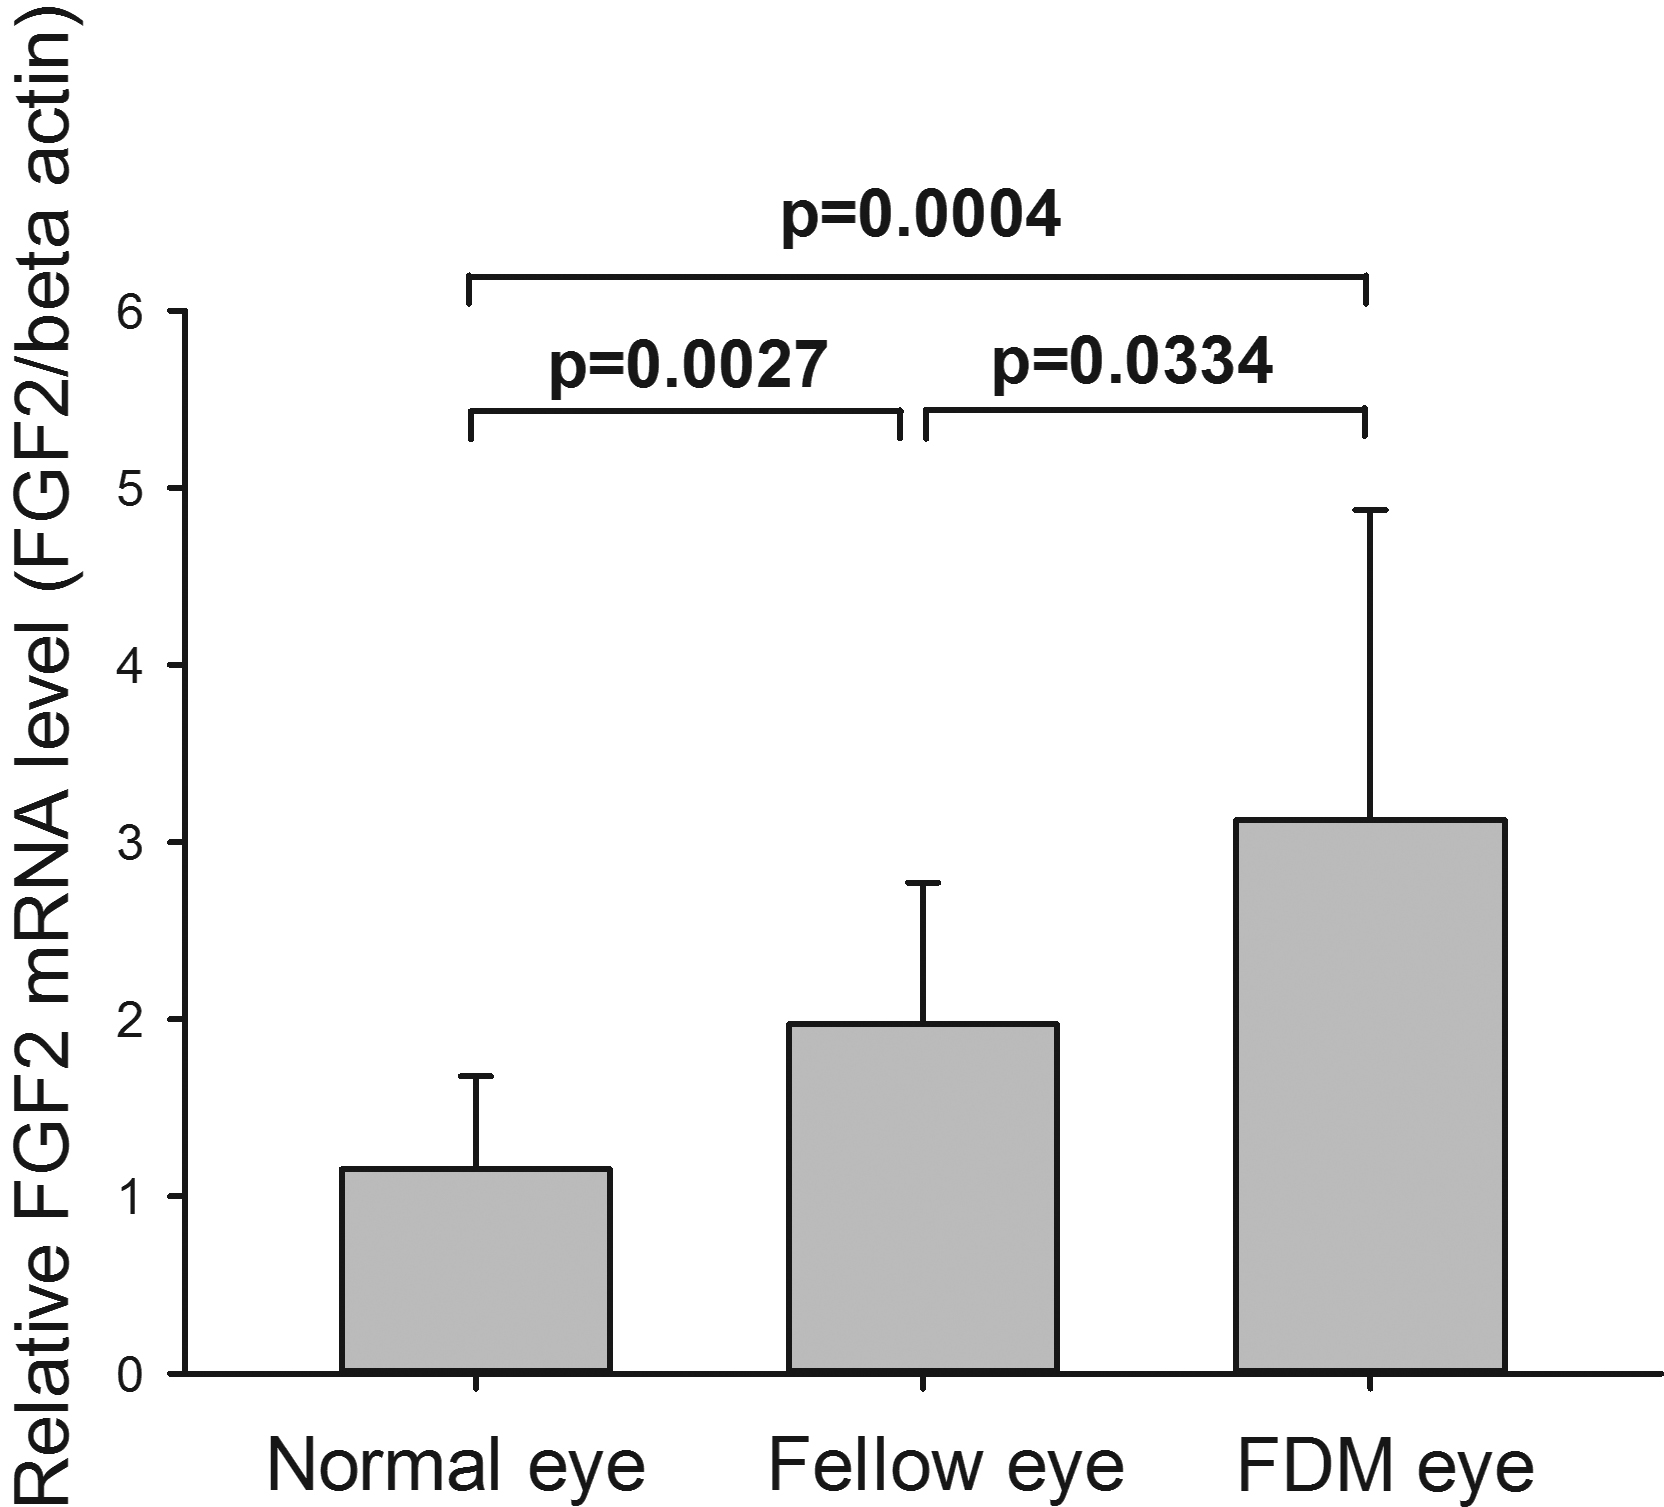
 Figure 1
of An, Mol Vis 2012; 18:471-478.
Figure 1
of An, Mol Vis 2012; 18:471-478.