Figure 3. Effect of Gly therapy on the opacity of the lenses in STZ-diabetic rats. A: Photographs of lenses from each group at the end of 12 weeks. B: Progression of cataract in diabetic rats throughout the experimental period. Cataract formation was scored biweekly according
to the following classification: clear normal lens (O), peripheral vesicles (I), peripheral vesicles and cortical opacities
(II), diffuse central opacities (III) and mature cataract (IV). The scores of cataracts in each group were averaged at the
given time and the average score of the cataract was plotted as a function of time. There was a significant difference (p<0.001)
between the average score of the cataract of groups D and DG from six weeks to the end of the study. C: Maturation of the cataract in diabetic rats after 12 weeks. Cataract development in rats was observed on week 12 of the
study and the number of lenses that developed opacity against the total number of lenses was considered for calculating the
percentage of incidence of cataract in each group. N: normal rats; D: diabetic rats; DG: diabetic rats with Gly; and NG: normal
rats with Gly.
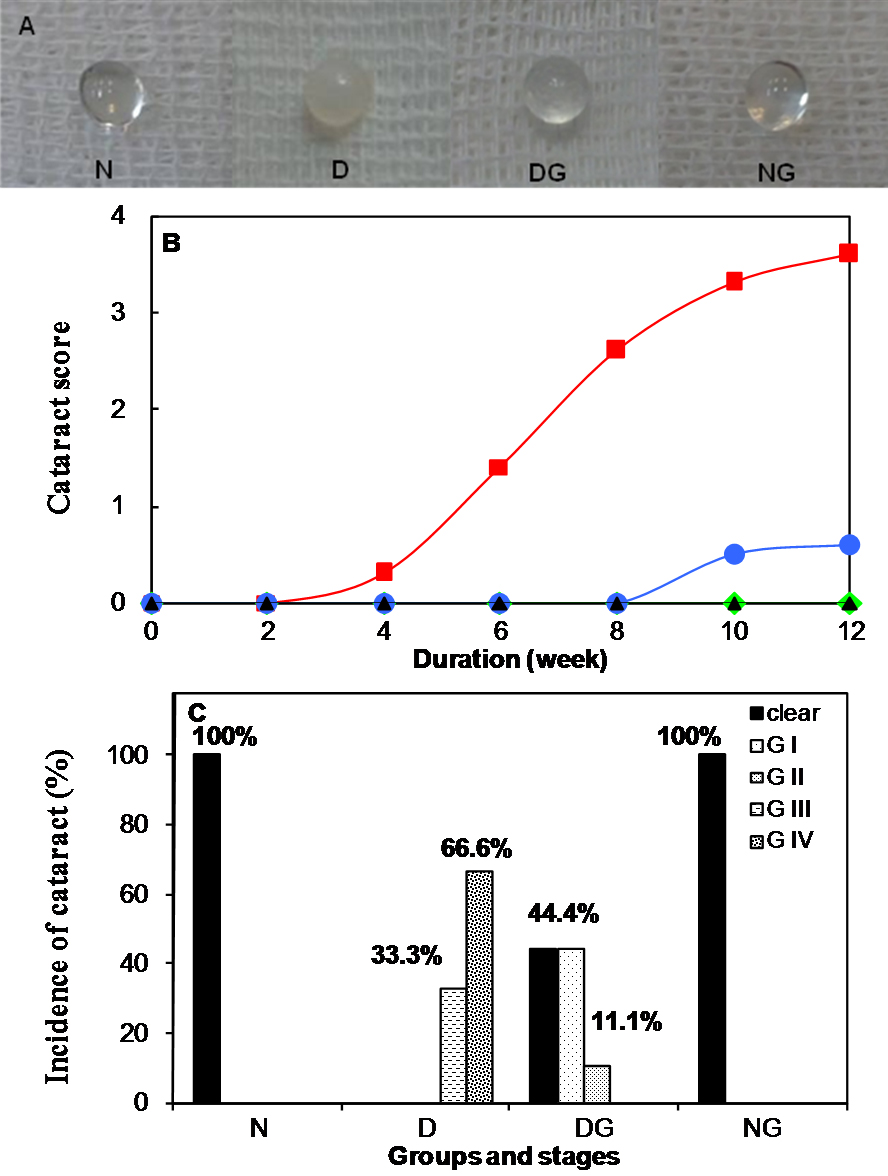
 Figure 3 of
Bahmani, Mol Vis 2012; 18:439-448.
Figure 3 of
Bahmani, Mol Vis 2012; 18:439-448.