Figure 2. Changes in the serum and
blood biochemical parameters in different groups of rats at the
different times of the experiment. A: Glucose
concentration, B: Percent of HbA1c, C:
Fluorescence intensity of AGEs, and D: FRAP. N: normal
rats; D: diabetic rats; DG: diabetic rats with Gly; and NG:
normal rats with Gly. “a” indicates the significance of the data
that compares group N versus all groups. “b” indicates the
significance of the data that compares group D versus groups of
glycine-treated rats. *, p<0.05; #, p<0.01; and †,
p<0.001.
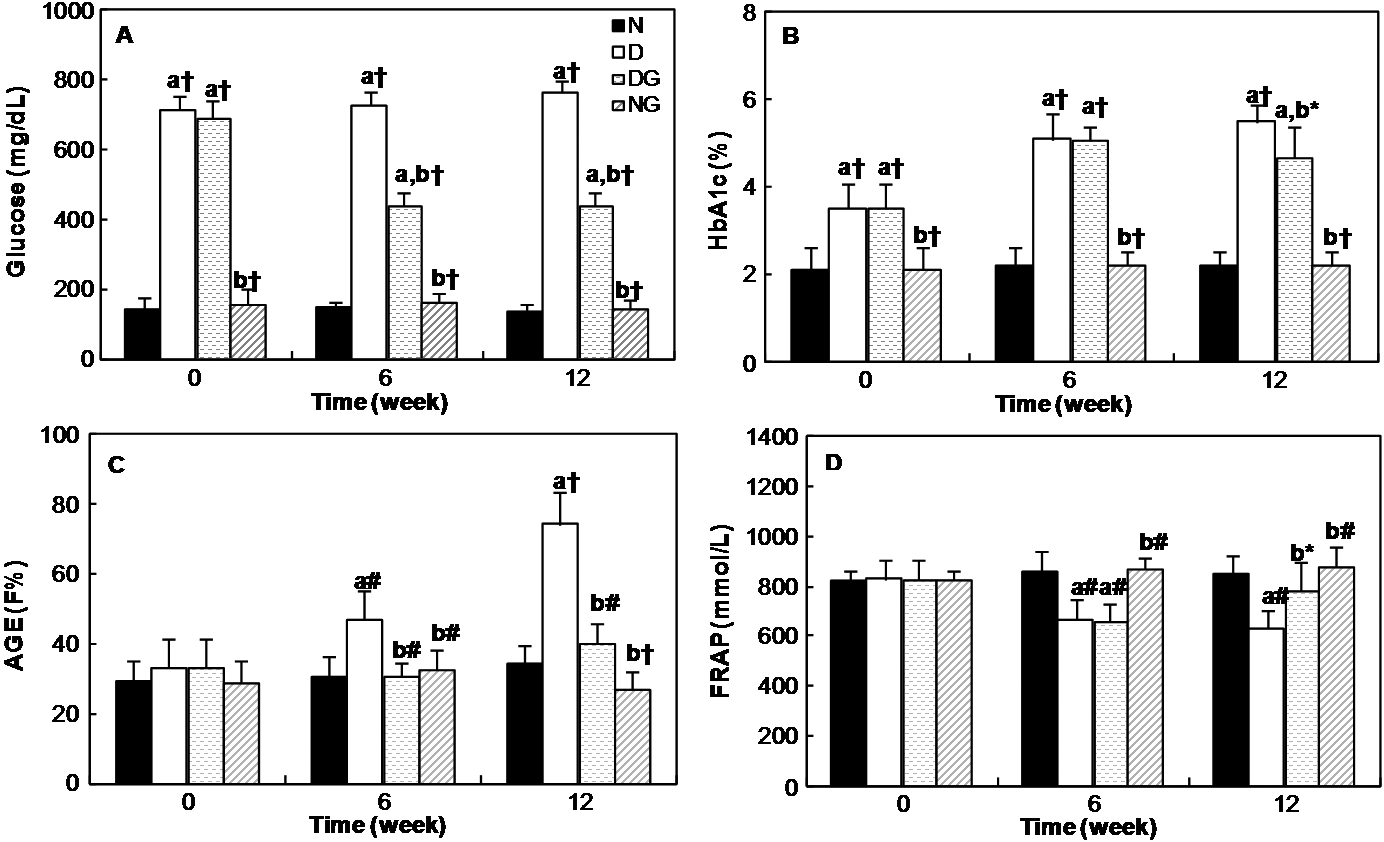
 Figure 2
of Bahmani, Mol Vis 2012; 18:439-448.
Figure 2
of Bahmani, Mol Vis 2012; 18:439-448.