Figure 1. Changes in the rat’s bodyweight during the course of the experiment. The data shows the average results in all the animals
in a given group at a given time. The weights of the normal groups were significantly different from those of the diabetic
groups (p<0.01) and there were no significant differences between the two diabetic groups at any time. N: normal rats; D:
diabetic rats; DG: diabetic rats with Gly; and NG: normal rats with Gly.
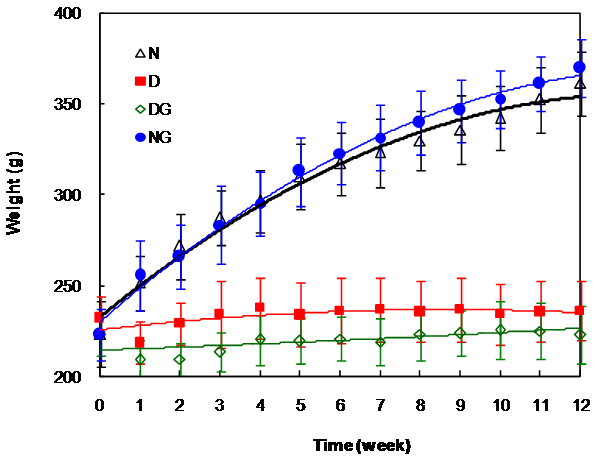
 Figure 1 of
Bahmani, Mol Vis 2012; 18:439-448.
Figure 1 of
Bahmani, Mol Vis 2012; 18:439-448.