Figure 1. Scatter plots showing distribution level of IL-10, IL-12, IFN-γ, IFN-α, CXCL8, CXCL-9, and IL-9 in aqueous humor from POAG
(circles), PACG (squares) and cataract controls (triangles). A Mann–Whitney U test with Bonferroni correction was performed
between groups and a significant difference was accepted at p≤0.05. The solid lines indicate median concentrations. Median
concentrations of IL-10 (p=0.050), IL-12 (p=0.003), IFN-γ (p=0.002), IFN-α (p=0.034), IL-9 (p=0.032), and CXCL9 (p=0.006)
were significantly higher in the glaucoma group compared to the cataract controls. Significantly elevated concentrations of
IL-12 (p=0.011), IFN-γ (p=0.005), and CXCL9 (p=0.047) was observed in the POAG aqueous, while CXCL8 (p=0.015) and CXCL9 (p=0.023)
concentrations were significantly higher in the PACG group, compared to the cataract group.
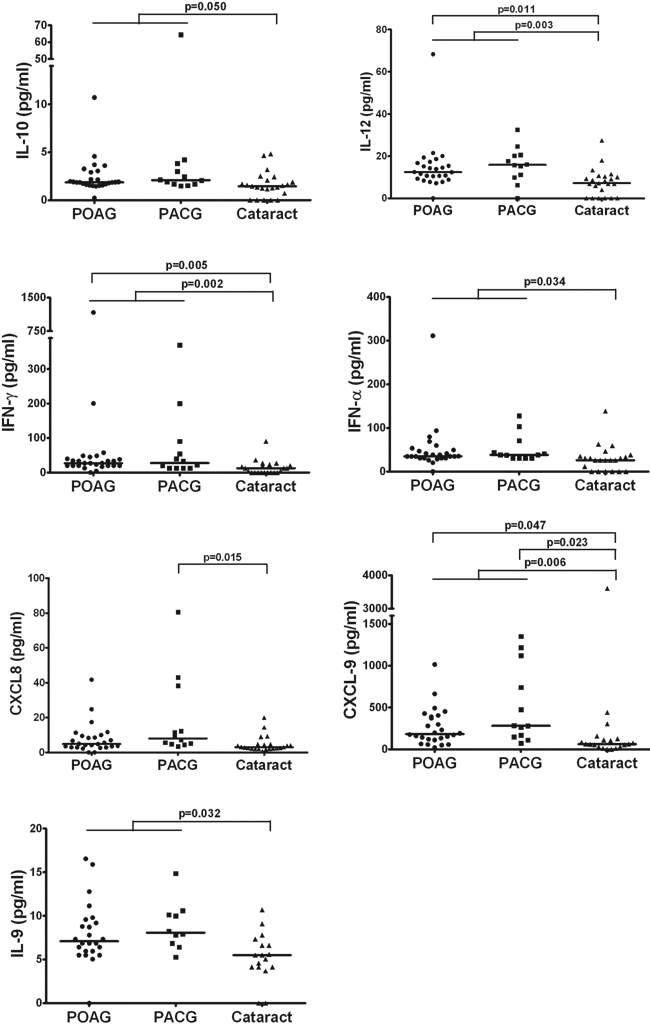
 Figure 1 of
Chua, Mol Vis 2012; 18:431-438.
Figure 1 of
Chua, Mol Vis 2012; 18:431-438.