Figure 1. NICD transgene
expression. A: Schematic view of the experimental
strategy. R26fN1-ICD mice were crossed with K14-cre+/+
mice to generate NICD overexpression corneal epithelium
in K14-cre+/−/NICD+ mice.
F, floxed. B: mRNA levels of NICD and its direct
downstream transcription targets, Hes1 and Hey1,
were assessed by a quantitative reverse transcription-PCR
analysis of cornea extract RNA from 8-week-old WT and K14-cre+/−/NICD+
mice. Each bar represents average±standard deviation (SD) of
three independent experiments. Two-tail t-test:
*p<0.05. n=3.
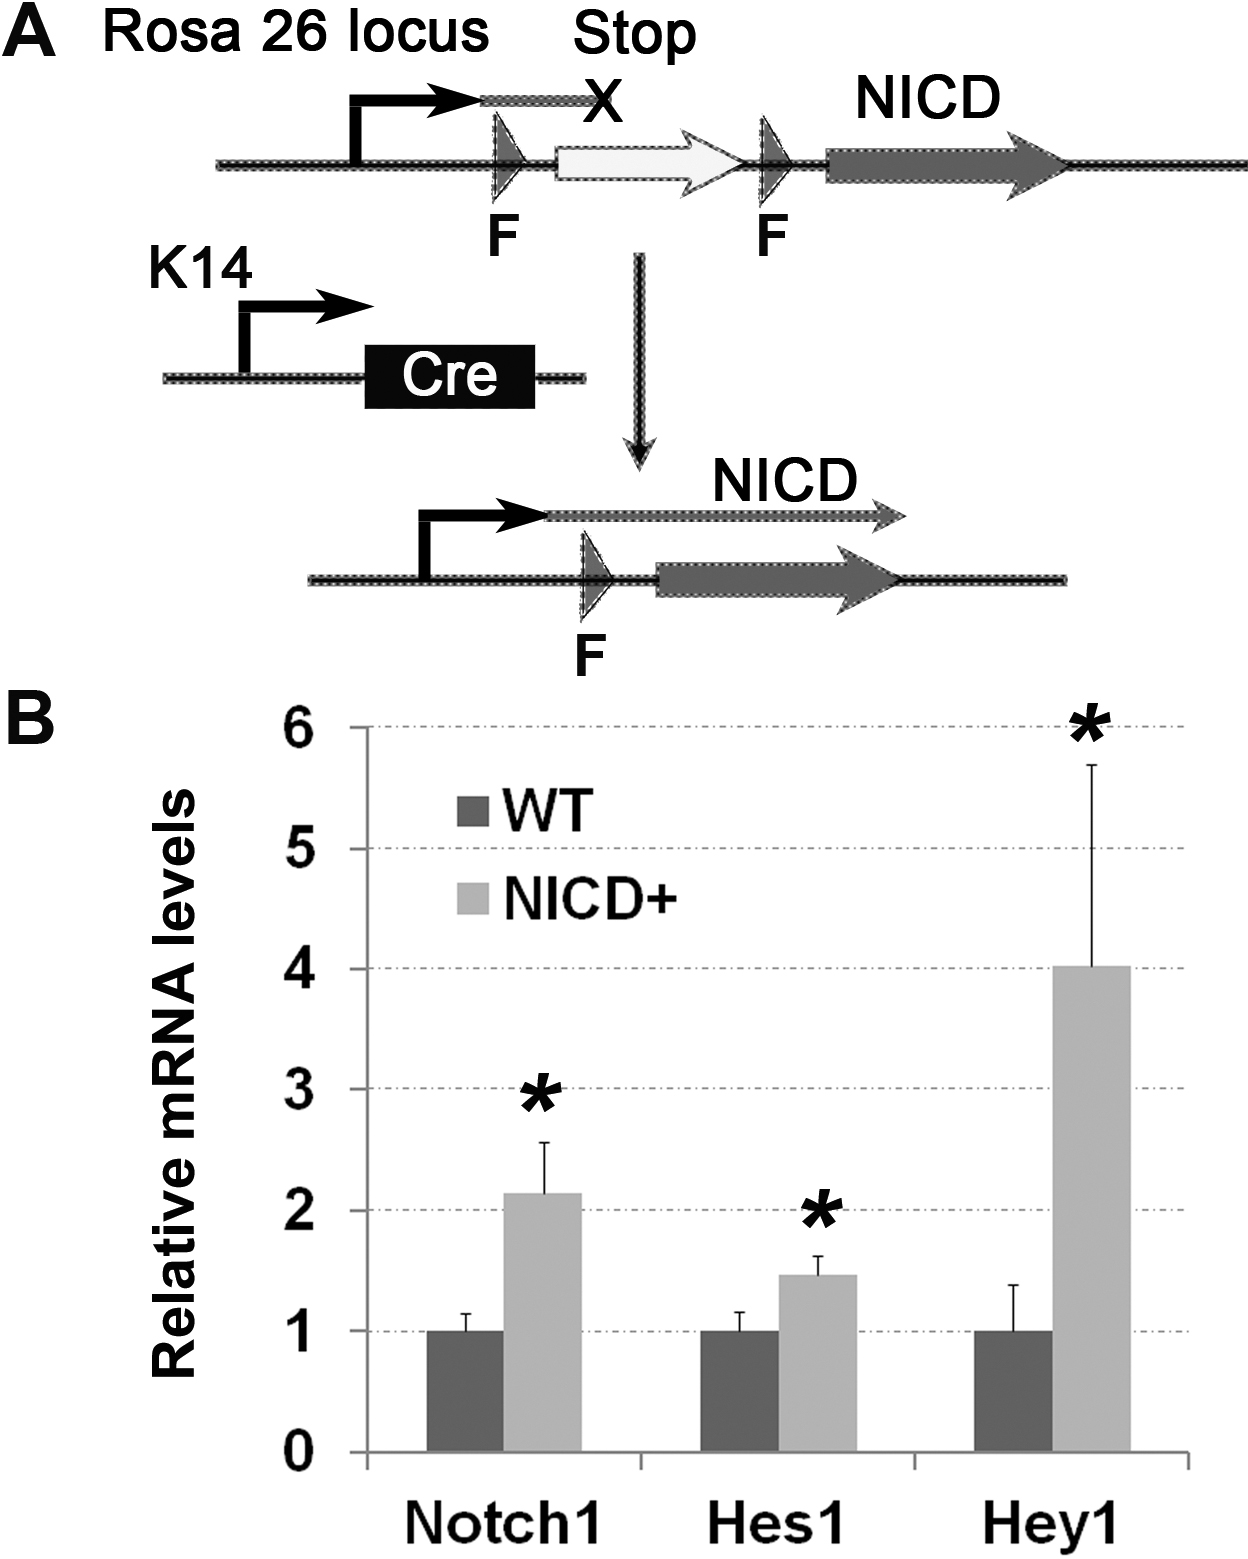
 Figure 1
of Lu, Mol Vis 2012; 18:403-411.
Figure 1
of Lu, Mol Vis 2012; 18:403-411.