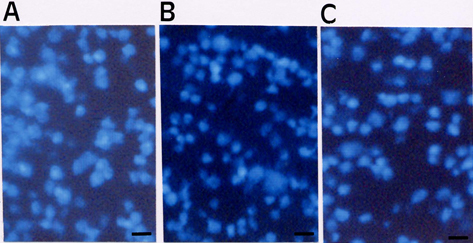
Figure 2. Surviving retinal ganglion
cells distribution in the retina in a rat model of chronic
glaucoma. Three groups of animals:
A: control,
B:
EGb761-treated for 5 months, and
C: vehicle-treated. A
difference between surviving retinal ganglion cells distribution
in eyes with elevated IOP that were treated with EGb 761 and
vehicle. Reproduced with permission from Hirooka et al. [
71].
 Figure 2
of Cybulska-Heinrich, Mol Vis 2012;
18:390-402.
Figure 2
of Cybulska-Heinrich, Mol Vis 2012;
18:390-402.