Figure 6. The results of genetic
linkage mapping using central retinal avascular area as the
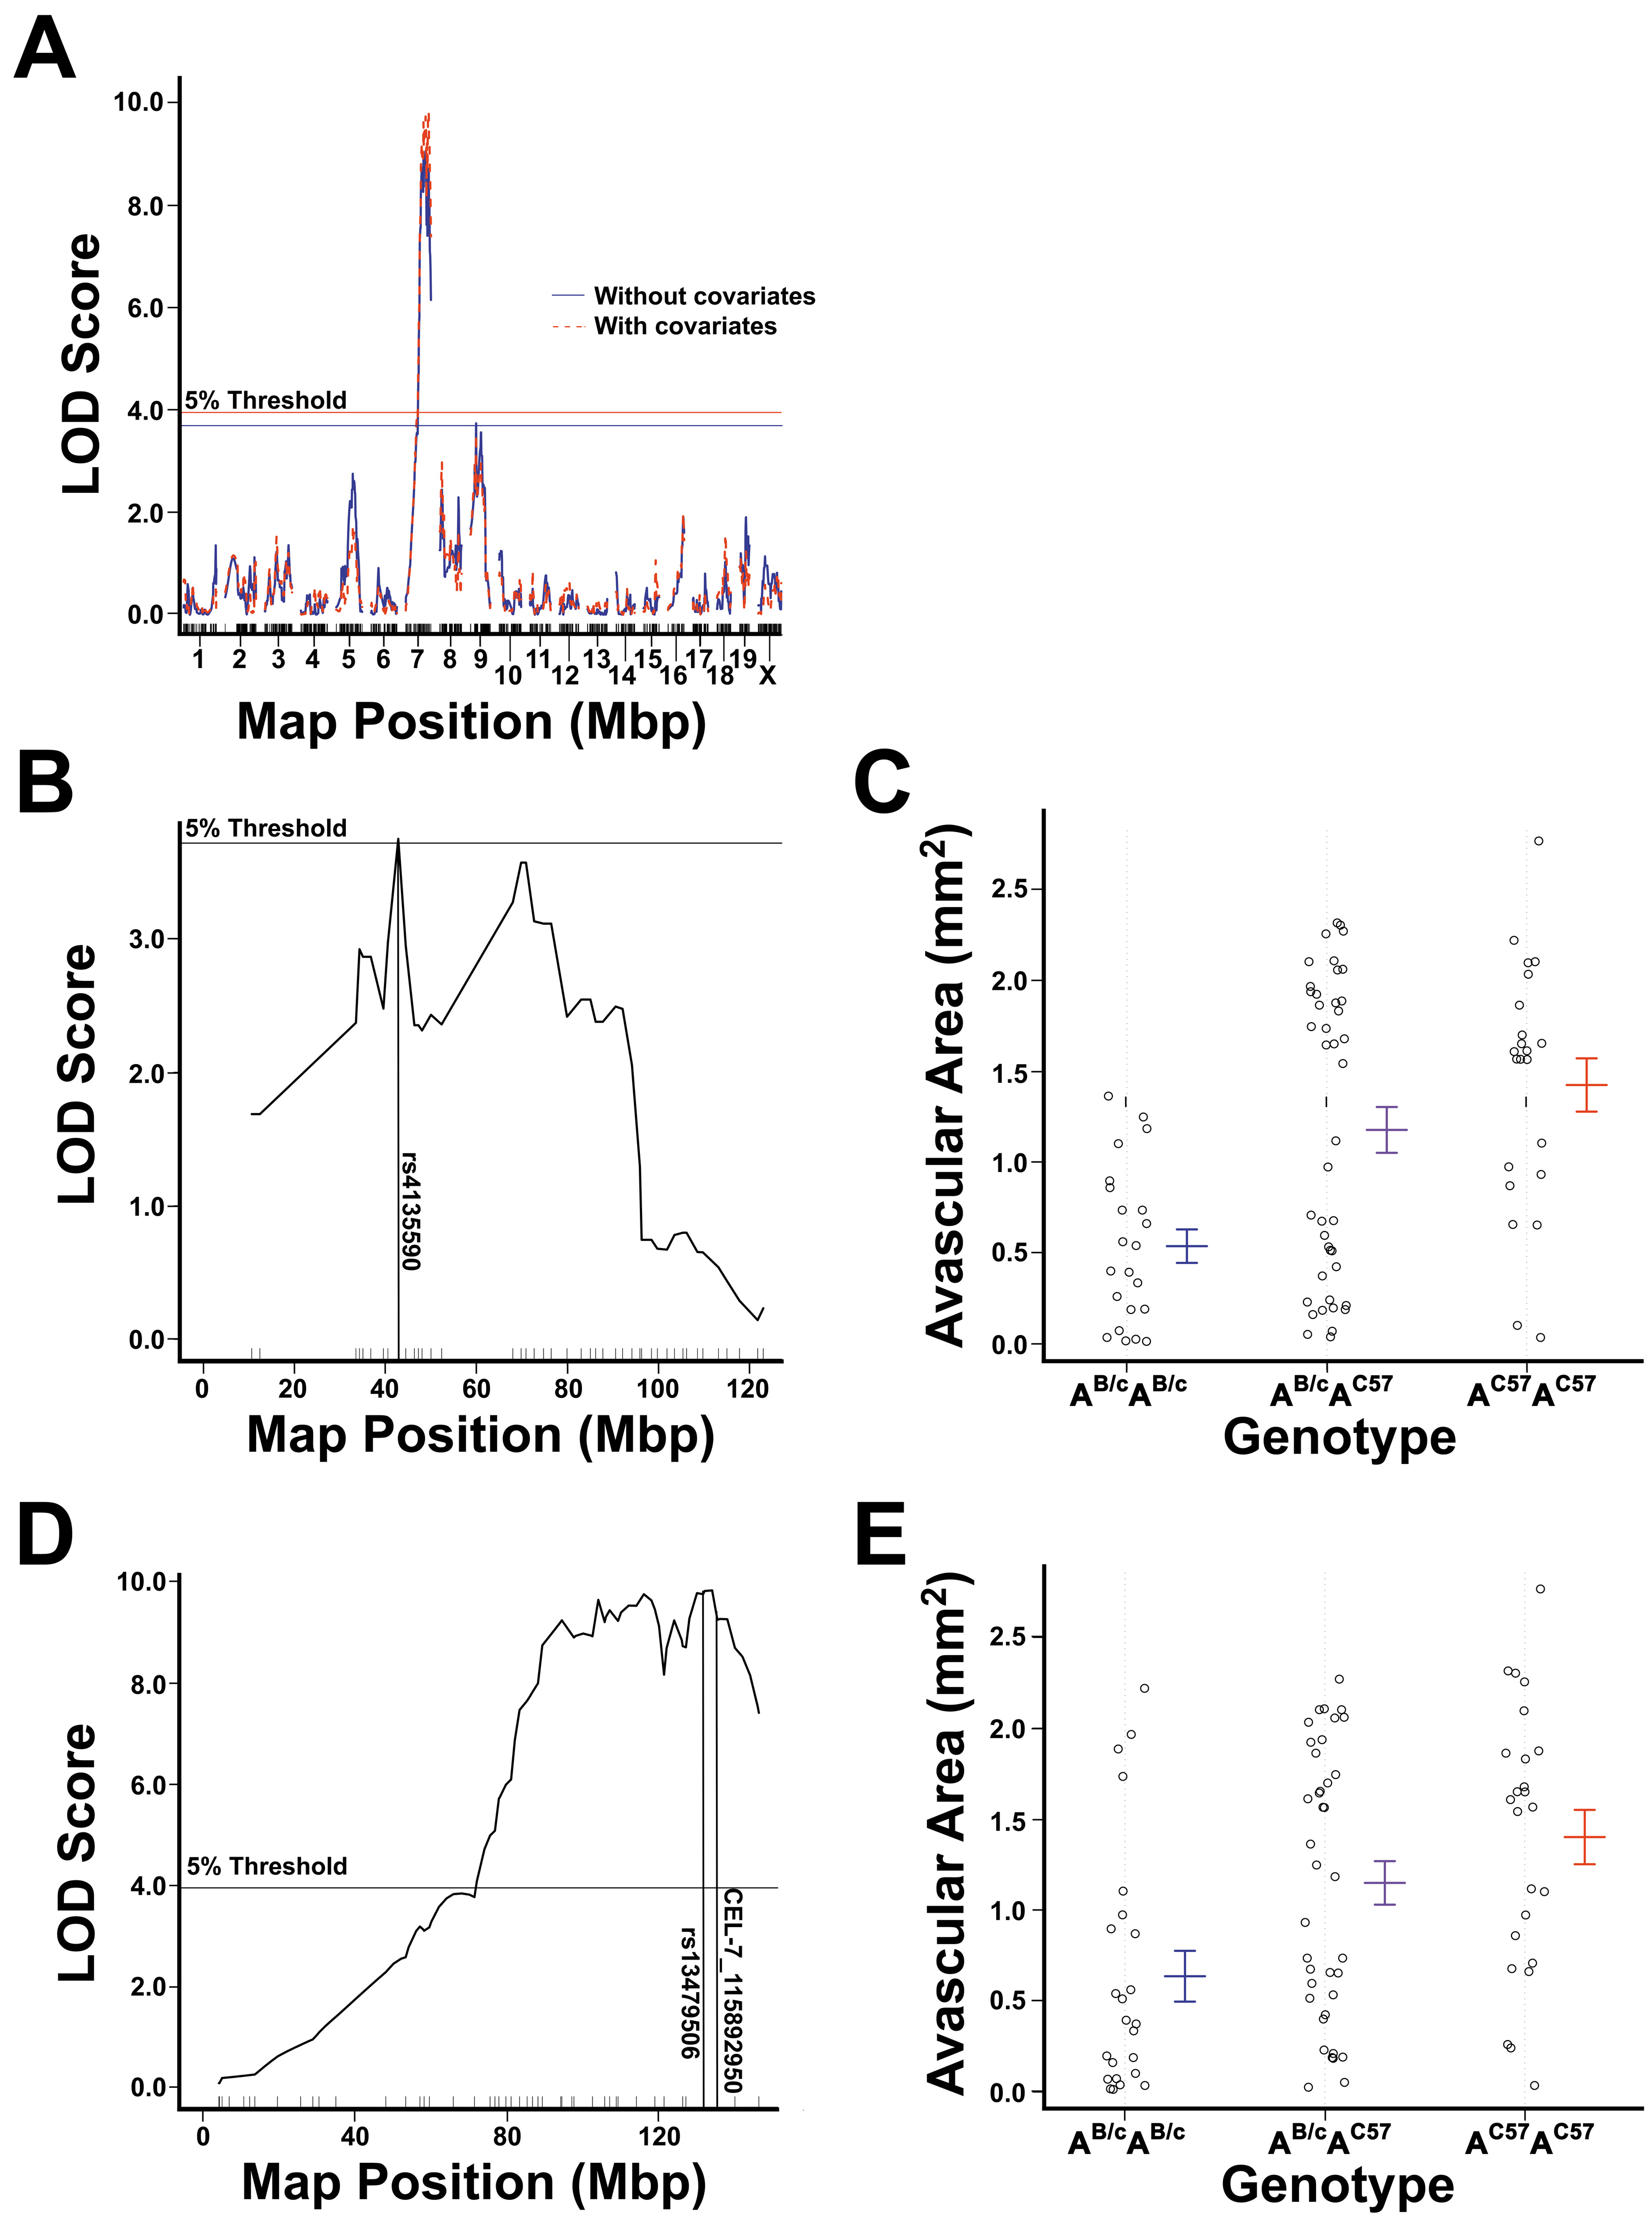
phenotype.
A: Linkage map of avascular area across the
whole genome created using no covariates (blue) and using
weight, paternal grandmother, and sex as additive covariates in
the analysis (red). Empirically derived genome-wide (alpha=0.05)
thresholds of significance are shown as horizontal lines. For
mapping without covariates the threshold of significance was a
logarithm of odds (LOD) score of 3.75. For mapping with
covariates the threshold of significance LOD score of 3.81.
Mapping without covariates identified peaks on chromosomes 7
(LOD=8.90) and 9 (LOD=3.75). Mapping with covariates identifed a
peak on chromosome 7 (LOD=9.83).
B: Linkage map of
avascular area across chromosome 9 created without inclusion of
covariates, showing a peak at SNP
rs4135590
(LOD=3.75, p=0.05).
C: Effect plots of primary peak on
chromosome 9. The BALB/cByJ allelotype was found to be
additively protective against the development of OIR.
D:
Linkage map of avascular area across chromosome 7 created by
including weight, paternal grandmother, and sex as additive
covariates, showing a peak between SNPs
rs13479506
and CEL-7_115892950 (LOD=9.83, p<0.004).
E: Effect
plot of the peak on chromosome 7 at the nearest marker,
CEL-7_115892950. The BALB/cByJ allelotype at this locus is shown
to have a protective effect in a recessive manner.
 Figure 6
of O’Bryhim, Mol Vis 2012; 18:377-389.
Figure 6
of O’Bryhim, Mol Vis 2012; 18:377-389.