Figure 8. Representative FESEM select area EDS analysis of chicken ossicles. Surface (A, E) and interior (C, G) secondary electron images and corresponding spectrum (B, D, F, and H) are presented from two different developmental time periods E14 (A, B, C, and D) and E18 (E, F, G, and H). The regions outlined in magenta in the images indicate selected areas that were analyzed by EDS; corresponding spectra
are presented to the right. Scale bar, 400 µm.
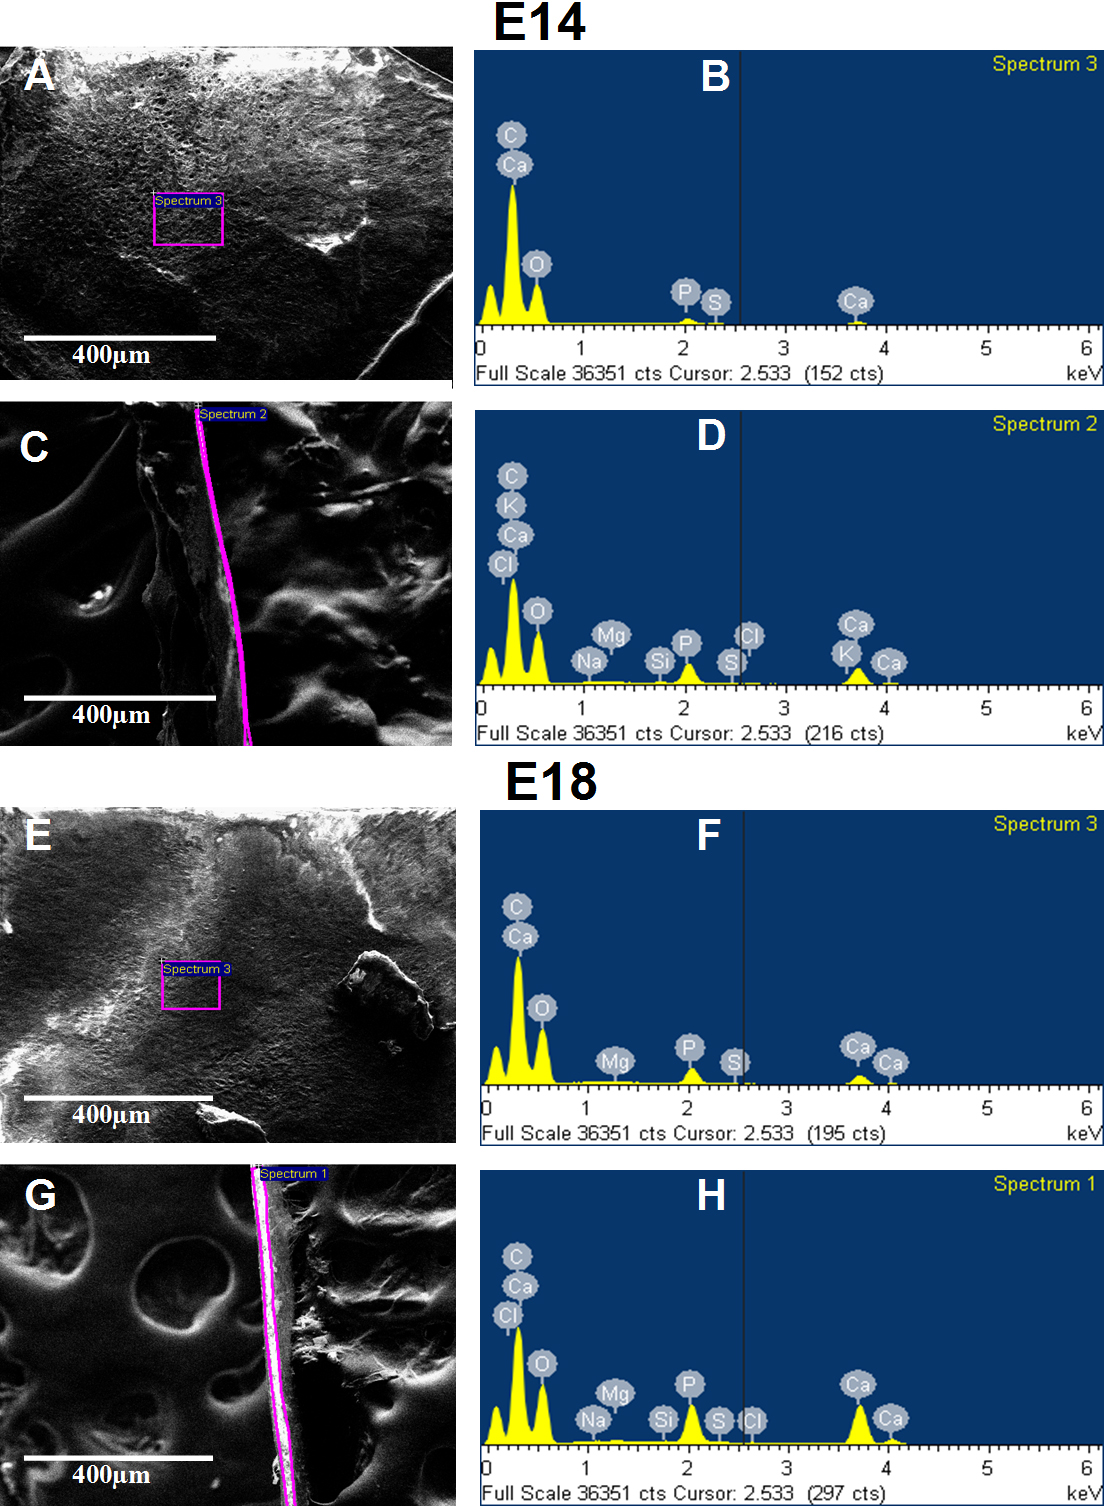
 Figure 8 of
Zhang, Mol Vis 2012; 18:348-361.
Figure 8 of
Zhang, Mol Vis 2012; 18:348-361.