Figure 4. Representative confocal
slices of Z-series, showing bone microporosities in chicken
scleral ossicles. The bone microporosities became visible by E15
(arrow) and their numbers increase for a given field of view
with increasing development of the ossicle plate (E15 to E21).
Scale bar: 50 µm.
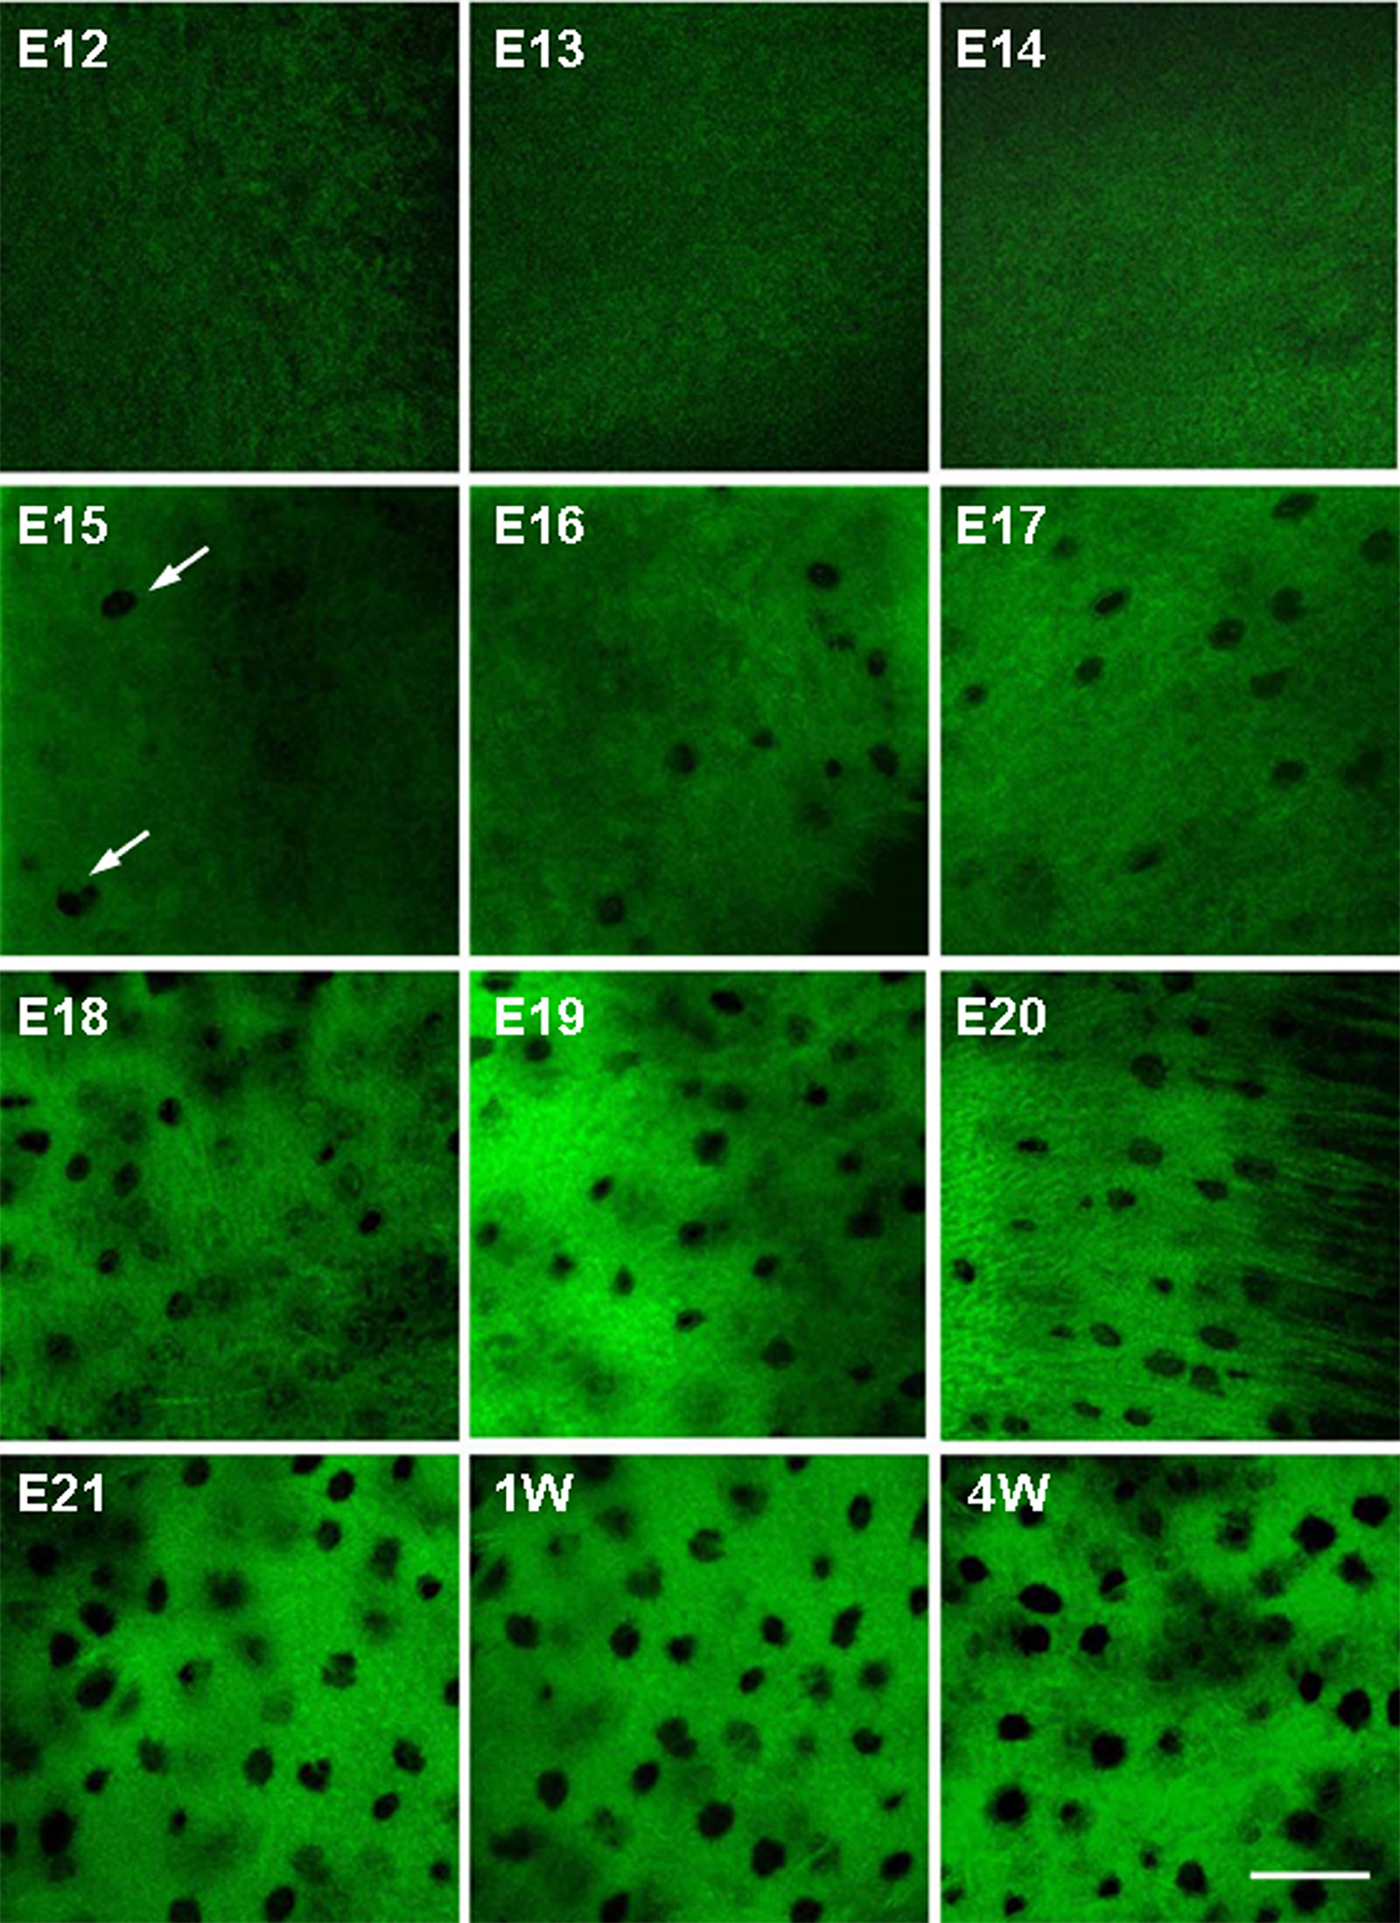
 Figure 4
of Zhang, Mol Vis 2012; 18:348-361.
Figure 4
of Zhang, Mol Vis 2012; 18:348-361.