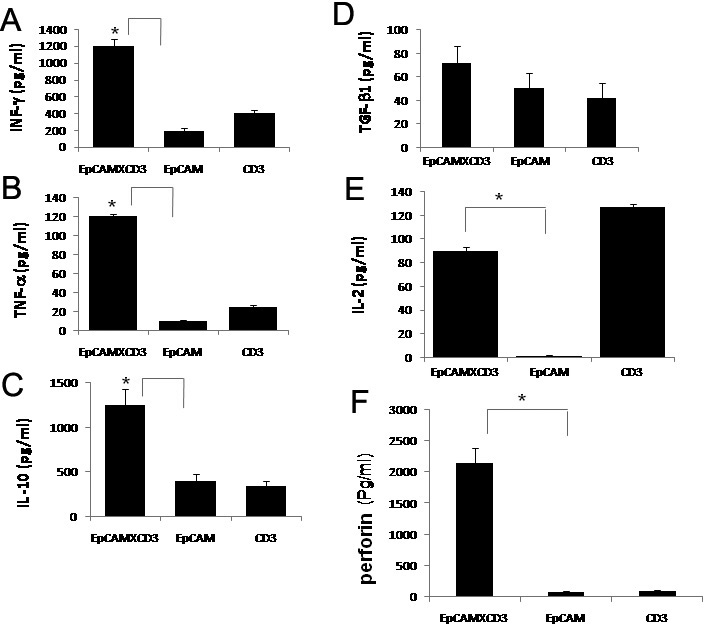
Figure 18. Production of cytokines by T-cells in the culture supernatant containing retinoblastoma (RB) tumor cells incubated with or
without epithelial cell adhesion molecule (EpCAM)xcluster determinant (CD)3 antibody. A: Bar diagram shows statistically significant (*p<0.05; by t-test) increase in the levels of interferon-gamma (INF-γ) in the culture supernatant incubated with EpCAMxCD3 (Epithelial
cell adhesion molecule X cluster determinant-3) antibody compared to that of EpCAM antibody. B: Bar diagram shows statistically significant (*p<0.05; by t-test) increase in the levels of tumor necrosis factor alpha (TNF-α) in the culture supernatant incubated with EpCAMxCD3 antibody
compared to that of EpCAM antibody. C: Bar diagram shows statistically significant (*p<0.05; by t-test) increase in the levels of interleukin-10 (IL-10) in the culture supernatant incubated with EpCAMxCD3 antibody compared
to that of EpCAM antibody. D: Bar diagram shows increase in the levels of transforming growth factor-β1 (TGF-β1) in the culture supernatant incubated
with EpCAMxCD3 antibody compared to that of EpCAM antibody. E: Bar diagram shows statistically significant (*p<0.05; by t-test) increase in the levels of interleukin-2 (IL-2) in the culture supernatant incubated with EpCAMxCD3 antibody compared
to that of EpCAM antibody. F: Bar diagram shows statistically significant (*p<0.05; by t-test) increase in the levels of perforin in the culture supernatant incubated with EpCAMxCD3 antibody compared to that of
EpCAM antibody. Error bars in the entire bar diagrams represent standard error mean of triplicate values.

 Figure 18 of
Mitra, Mol Vis 2012; 18:290-308.
  Figure 18 of
Mitra, Mol Vis 2012; 18:290-308.