Figure 17. Varying concentrations of epithelial cell adhesion molecule (EpCAM)xcluster determinant (CD)3 antibody inducing cytotoxicity
on retinoblastoma (RB) tumor cells. A: Graph shows the effect of increasing serial 10-fold concentrations of EpCAMxCD3 on the cytotoxicity of RB tumor cells at
different incubation periods. The error bars represent standard error mean of triplicate values. Asterisk mark represent statistically
significant (p<0.05; analyzed by Analysis of Variance method) increase in cytotoxicity of RB tumor cells at 16 h and 24 h
incubation periods compared to that of 2 h and 8 h incubation periods. B: Effect of varying concentrations of EpCAMxCD3 on five RB tumors. The graph shows the cytotoxic effects of various concentrations
of EpCAM×CD3 antibody on five RB primary tumors after 24 h of incubation. The error bars represent standard error mean of
triplicate values. The table under the graph represents the percentage cytotoxicity of each RB tumor at particular concentration
of EpCAMxCD3 antibody.
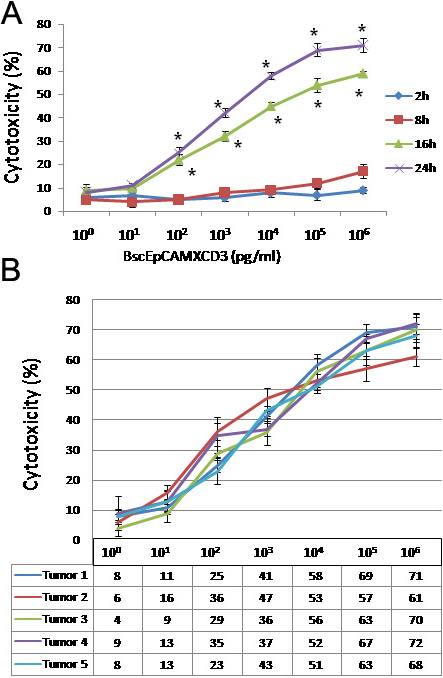
 Figure 17 of
Mitra, Mol Vis 2012; 18:290-308.
Figure 17 of
Mitra, Mol Vis 2012; 18:290-308.