Figure 16. Western blotting analysis demonstrating the levels of epithelial cell adhesion molecule (EpCAM) and β-catenin levels in EpCAM+ and EpCAM- cells. Panel 1 shows decreased levels of β-catenin in EpCAM- cells compared to that of EpCAM+ cells. Panel 2 shows decreased EpCAM levels in EpCAM- cells compared to EpCAM+ cells. Panel 3 shows equal expression of β-actin (loading controls) in both EpCAM+ and EpCAM- cells. kDa stands for kilo-dalton.
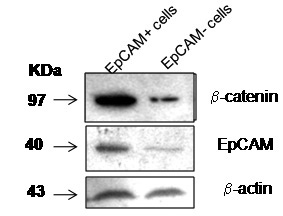
 Figure 16 of
Mitra, Mol Vis 2012; 18:290-308.
Figure 16 of
Mitra, Mol Vis 2012; 18:290-308.