Figure 15. Comparison of neurosphere forming potential between epithelial cell adhesion molecule (EpCAM)+ and EpCAM- cells. A: Phase contrast microscope image showing the formation of neurospheres by EpCAM– cells in the cell culture plates. B: Phase contrast microscope image showing increased number of neurospheres by EpCAM+ cells in the cell culture plates. C: Bar diagram showing the number of colonies formed by EpCAM+ cells and EpCAM- cells. Red bars indicate number of neurosphere clusters formed by EpCAM+ cells whereas blue bars indicate the number of neurosphere clusters formed by EpCAM- cells. Asterisk mark over red bars indicate statistically significant (p<0.05) increase in number of neurospheres as analyzed
by t-test. Black bars indicate decrease in number of neurospheres by EpCAM+ cells after siRNA treatment. Grey bars indicate number
of neurospheres formed by small interfering RNA (siRNA) untreated EpCAM+ cells (control cells–CTRL). Asterisk mark over black bar indicates statistically significant (p<0.05) decrease in number
of neurospheres as analyzed by t-test. The error bars represent standard error mean of triplicate values.
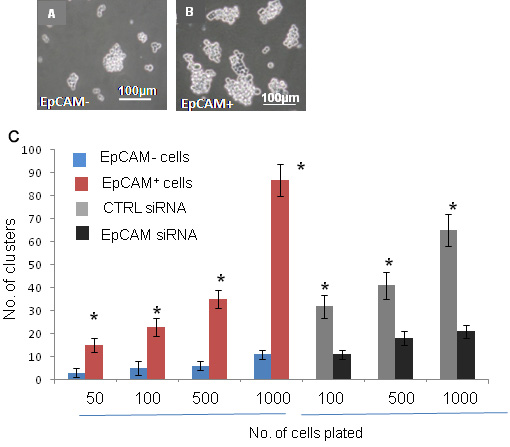
 Figure 15 of
Mitra, Mol Vis 2012; 18:290-308.
Figure 15 of
Mitra, Mol Vis 2012; 18:290-308.