Figure 14. Comparison of invasion property between epithelial cell adhesion molecule (EpCAM)+ and EpCAM- cells. A: Representative microscopy picture showing the invasion of EpCAM– Y79 cells. B: Representative microscopy picture showing the invasion of EpCAM+ Y79 cells. C: Bar diagram showing increased number of EpCAM+ cells (bar 2) invading the matrigel compared to EpCAM– cells (bar 1). Smilarly, bar 4 shows decrease in the invasion of EpCAM+ cells treated with EpCAM specific small interfering RNA when compared to small interfering RNA (siRNA) untreated EpCAM+ cells (bar 3). The error bars represent standard error mean of triplicate values. For statistical analysis, group 2 was compared
with group 1 and group 4 was compared to group 3. Asterisk mark represent p value less than 0.05 which is statistically significant
as analyzed by t-test.
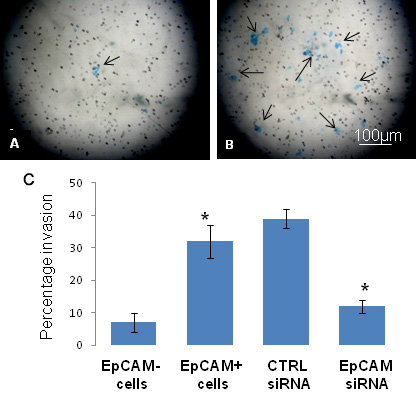
 Figure 14 of
Mitra, Mol Vis 2012; 18:290-308.
Figure 14 of
Mitra, Mol Vis 2012; 18:290-308.