Figure 13. Comparison of cell proliferation kinetics between epithelial cell adhesion molecule (EpCAM)+ and EpCAM- populations. The methyl thiazol tetrazolium (MTT) assay graph shows higher cell proliferation rate in EpCAM+ population compared to that of EpCAM- population. The viability was determined in both populations at day 2, 6, 10 and 14. Statistically significant increased
in cell viability of EpCAM+ population was observed at 6th, 10th and 14th day. Asterisk mark represent p value less than 0.05 as analyzed by t-test and the error bars represent standard error mean obtained from triplicate values.
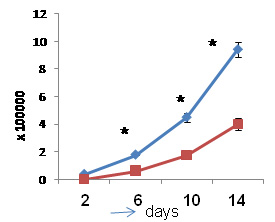
 Figure 13 of
Mitra, Mol Vis 2012; 18:290-308.
Figure 13 of
Mitra, Mol Vis 2012; 18:290-308.