Figure 11. Determining the purity of epithelial cell adhesion molecule (EpCAM)+ cells in the magnetic bead isolation process.A: Scatter plots showing unstained cells for EpCAM as control. B: Scatter plot shows EpCAM expression in the native Y79 cells before subjecting to magnetic bead isolation assay. C: Scatter plot shows the EpCAM expression in the Y79 cells that were not bound to the magnetic beads.D: Scatter plot shows EpCAM expression in the Y79 cells sorted using EpCAM antibody coupled to magnetic beads.
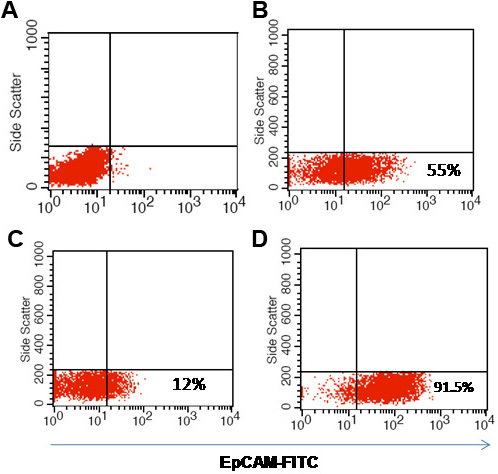
 Figure 11 of
Mitra, Mol Vis 2012; 18:290-308.
Figure 11 of
Mitra, Mol Vis 2012; 18:290-308.