Figure 1. Elimination of dead cell population from the final analysis.A: Scatter plot showing most cells with small size and high granularity, which represent dead cells; hence the dead were eliminated
from the final analysis. B: Plot showing 58% of the cells stained for PI were eliminated from the final analysis as the PI positive cells represent
dead cell population. C: Gated scatter plot shows control cells without PI stain.
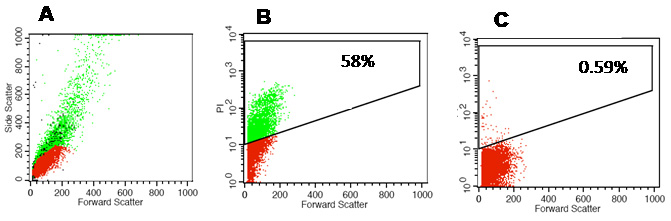
 Figure 1 of
Mitra, Mol Vis 2012; 18:290-308.
Figure 1 of
Mitra, Mol Vis 2012; 18:290-308.