Figure 5 of
Roberts, Mol Vis 2012; 18:280-289.
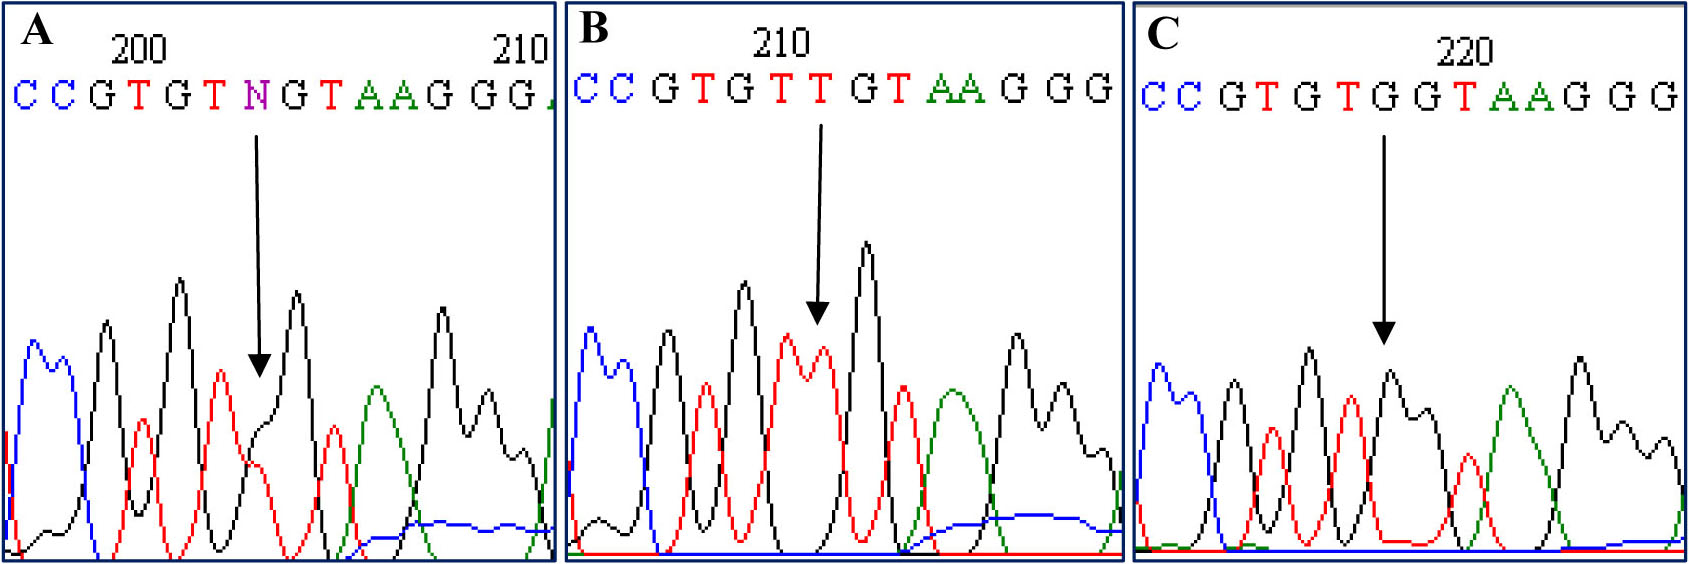
Figure 5.
Sequencing electropherograms show (
A
) the heterozygous c.768G>T mutation, (
B
) homozygous c.768G>T mutation, and (
C
) the wild-type sequence following denaturing high-performance liquid chromatography screening.
 Figure 5
of Roberts, Mol Vis 2012; 18:280-289.
Figure 5
of Roberts, Mol Vis 2012; 18:280-289.