Figure 7. Fluorescence photomicrographs of retinal sections from a terminal deoxynucleotidyl transferase-mediated uridine 5′-triphosphate-biotin
nick end labeling (TUNEL) assay at 4 weeks after injection. Representative photographs 4 weeks after injection with PBS (A), blank-NPs (B) PEDF (C) and PEDF-NPs (D) are shown. ILM; inner limiting membrane, GCL; ganglion cell layer, IPL; inner plexiform layer, INL; inner nuclear layer,
ONL; outer nuclear layer. A bar represents 50 µm. E: Mean percentage of TUNEL-positive cells of RCS rats at 4 weeks after injection. Data are shown as the mean±SD (n=4 in each
group). The percentage of TUNEL-positive cells in the ONL was significantly lower in PEDF-NP-treated eyes than in PEDF-treated
eyes (*p=0.0007).
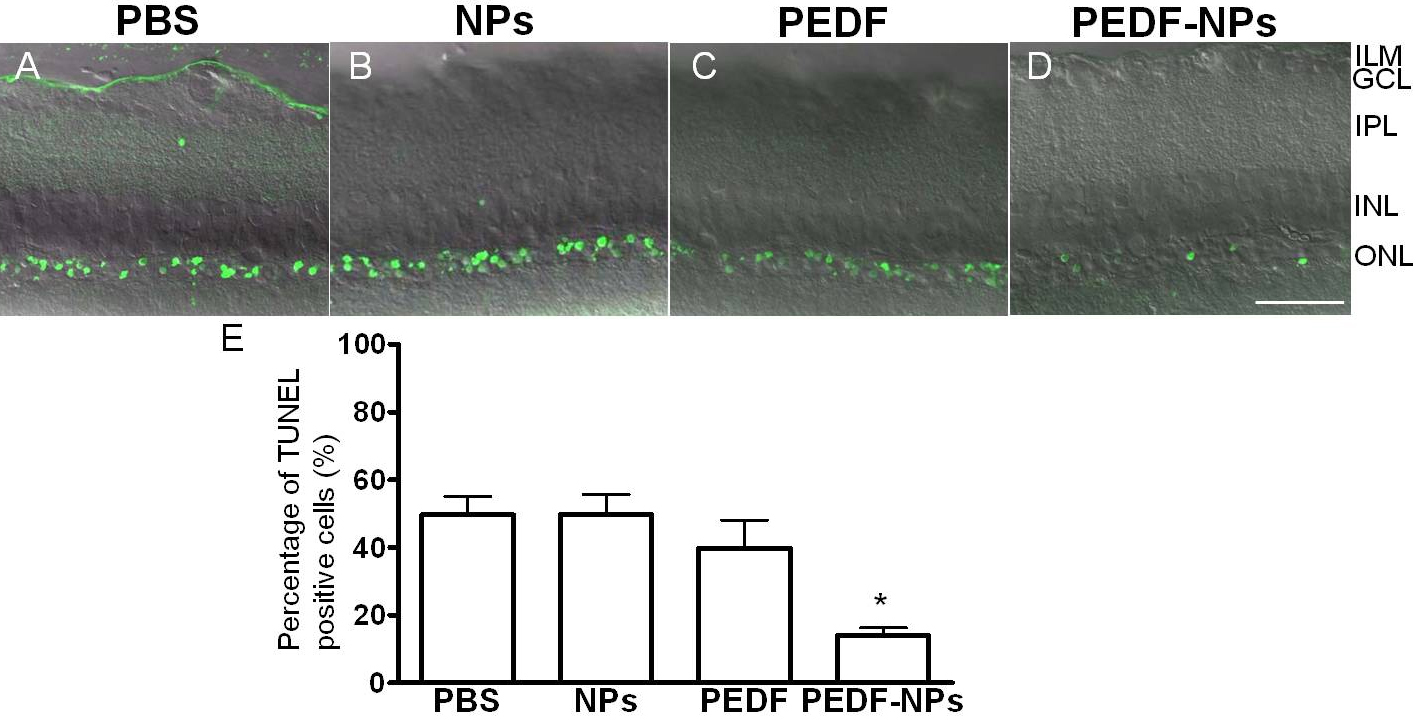
 Figure 7 of
Akiyama, Mol Vis 2012; 18:3079-3086.
Figure 7 of
Akiyama, Mol Vis 2012; 18:3079-3086.