Figure 6. Physiologic rescue of Royal College of Surgeons (RCS) rats at 4 (A, B) and 8 (C, D) weeks after injection. The amplitudes of a- (A, C) and b- (B, D) waves were measured and plotted as each point on the graph. Each bar on the graph represents the mean amplitude for each
group. PEDF-NP-treated eyes showed significant preservation of a- and b-wave amplitudes at 8 weeks after injection, compared
with PEDF-treated eyes (both p=0.0339).
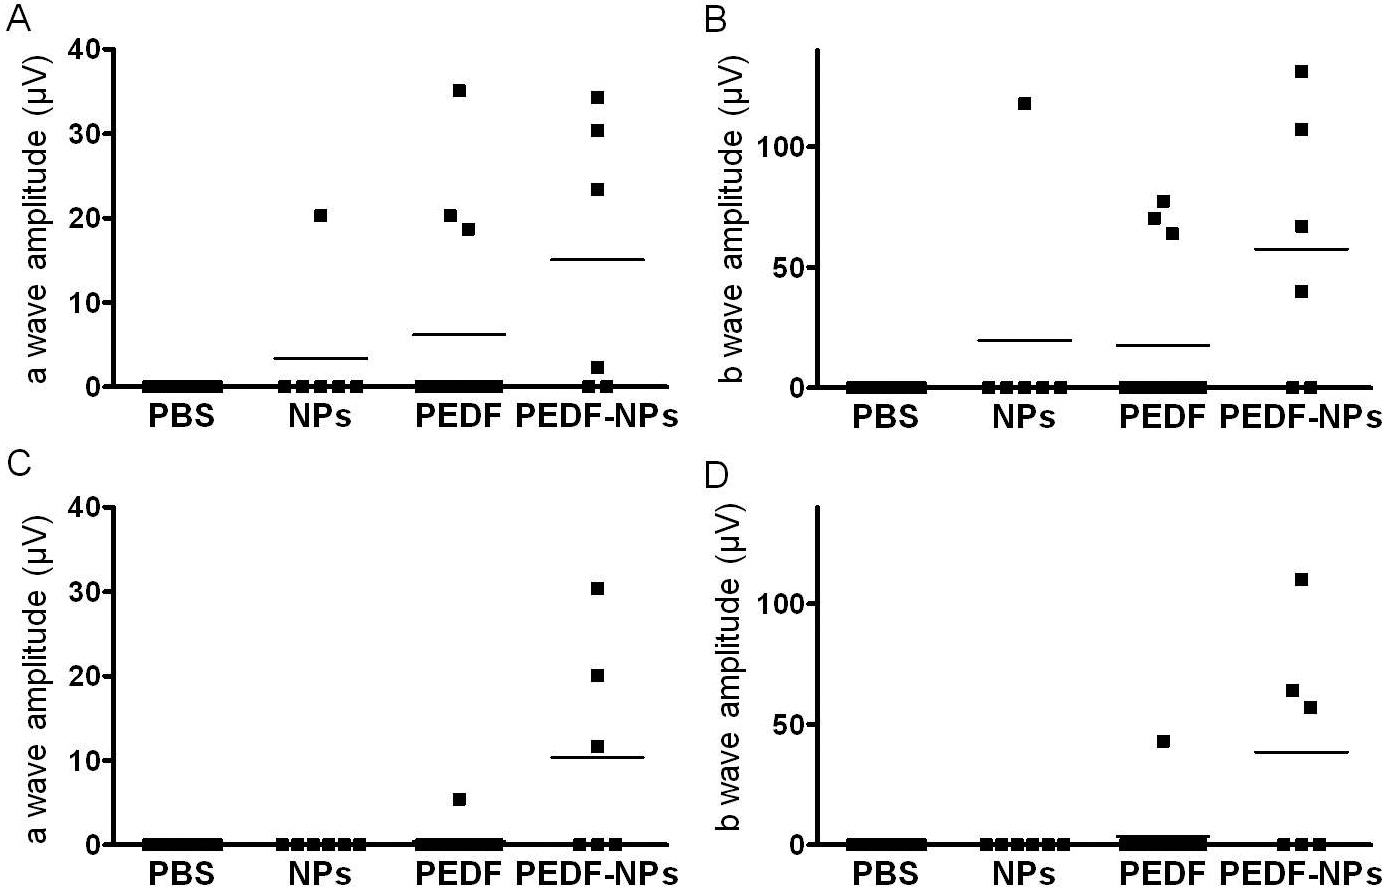
 Figure 6 of
Akiyama, Mol Vis 2012; 18:3079-3086.
Figure 6 of
Akiyama, Mol Vis 2012; 18:3079-3086.