Figure 3. Quantitative comparison of rod spherule and cone pedicle mitochondrial cristae measurements in control, Bcl-xL, lead-exposed
(Lead), and Bcl-xL and lead-exposed (Bcl-xL/Lead) mice obtained from tomographic reconstructions. The mean values for all
mitochondrial measures in the control and Bcl-xL mice were not significantly different, so they were combined (blue bars).
Data for the Lead (red bars) and Bcl-xL/Lead (green bars) mice are presented for each plot. A–C: Rod spherule mitochondria. A: The cristae surface area/mitochondrial surface and cristae volume/mitochondrial volume decreased in Lead. Bcl-xL overexpression
(Bcl-xL/Lead) partially protected against the loss of cristae surface and fully protected against the loss of cristae volume.
B: The number of crista segments and cristae per volume were not different in the Control/Bcl-xL, lead, or Bcl-xL/Lead mice.
C: The number of segments per crista and the fraction of cristae with multiple segments increased in the Lead mice and were
blocked in the Bcl-xL/Lead mice. D–F: Cone pedicle mitochondria. D: The cristae surface area/mitochondrial surface and cristae volume/mitochondrial volume increased in the Lead mice and were
protected in the Bcl-xL/Lead mice. E: The number of crista segments increased in the Lead and Bcl-xL/Lead mice. The cristae per volume were not different in the
Control/Bcl-xL, Lead, or Bcl-xL/Lead mice. F: The number of segments per crista and the fraction of cristae with multiple segments increased in the Lead and Bcl-xL/Lead
mice. Values represent mean±SEM measurements from three to six different mice from different litters per treatment. Values
sharing the same superscript differed from each other at p<0.05.
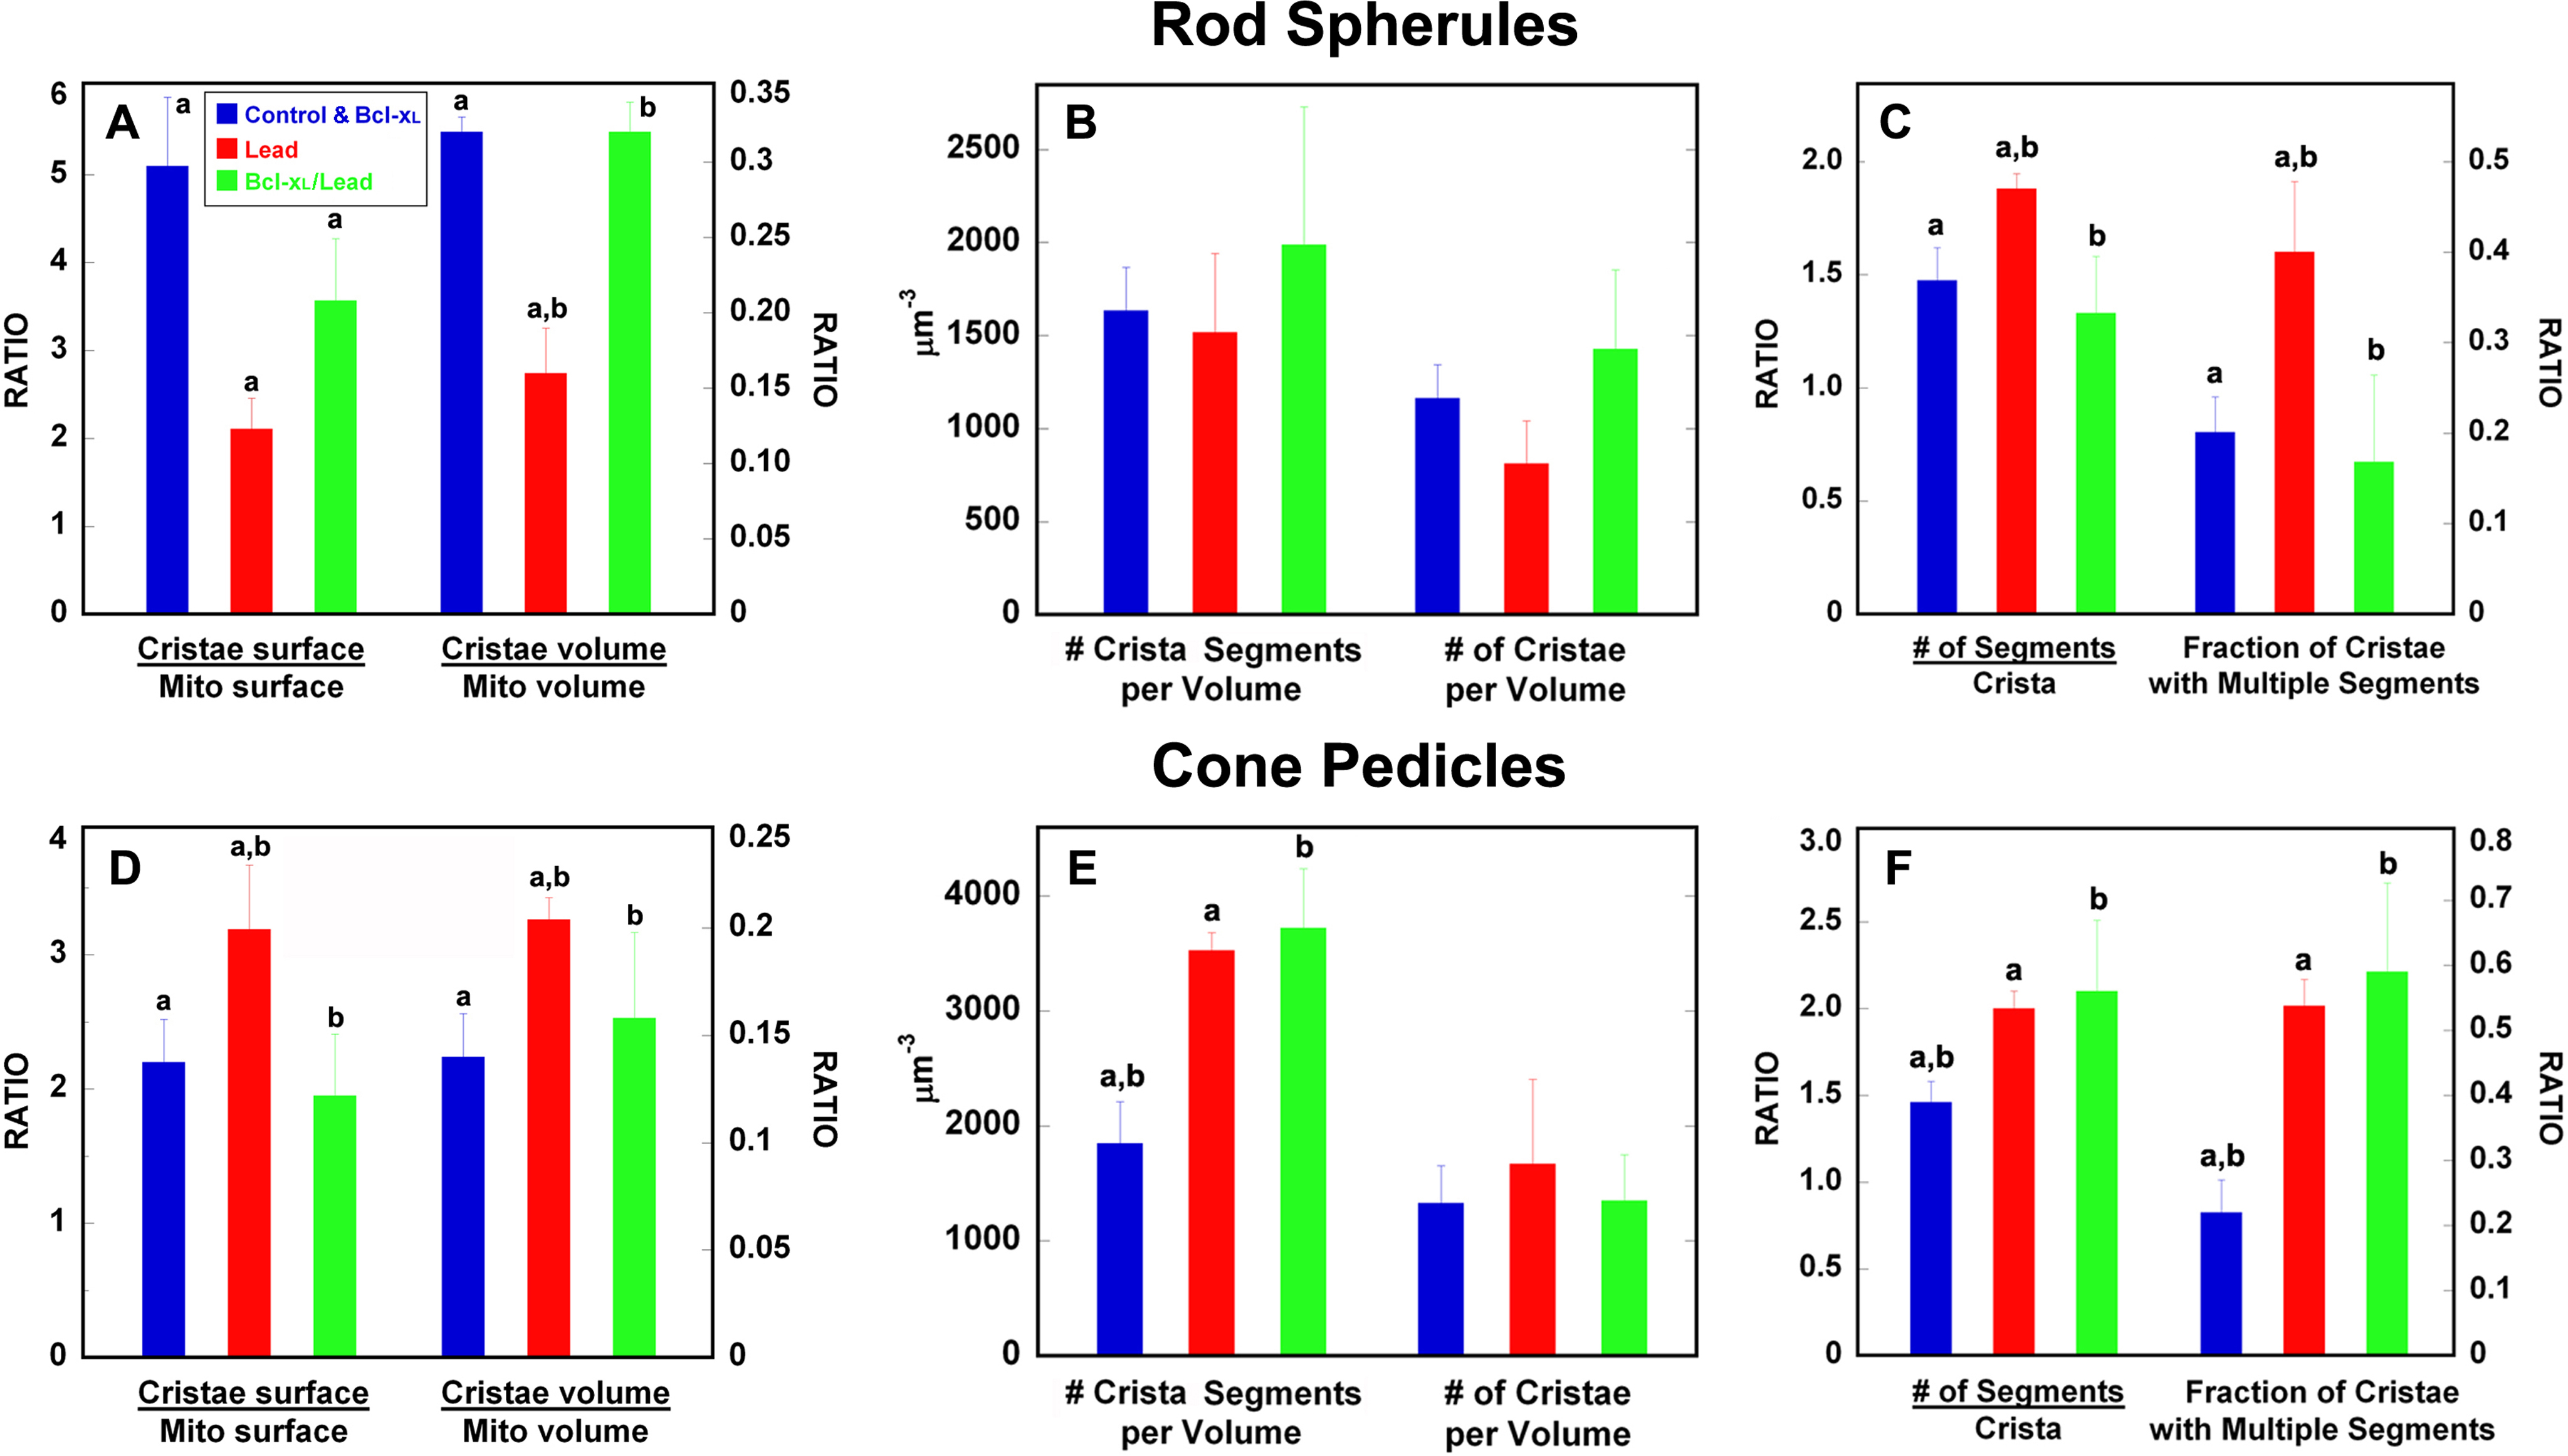
 Figure 3 of
Perkins, Mol Vis 2012; 18:3029-3048.
Figure 3 of
Perkins, Mol Vis 2012; 18:3029-3048.