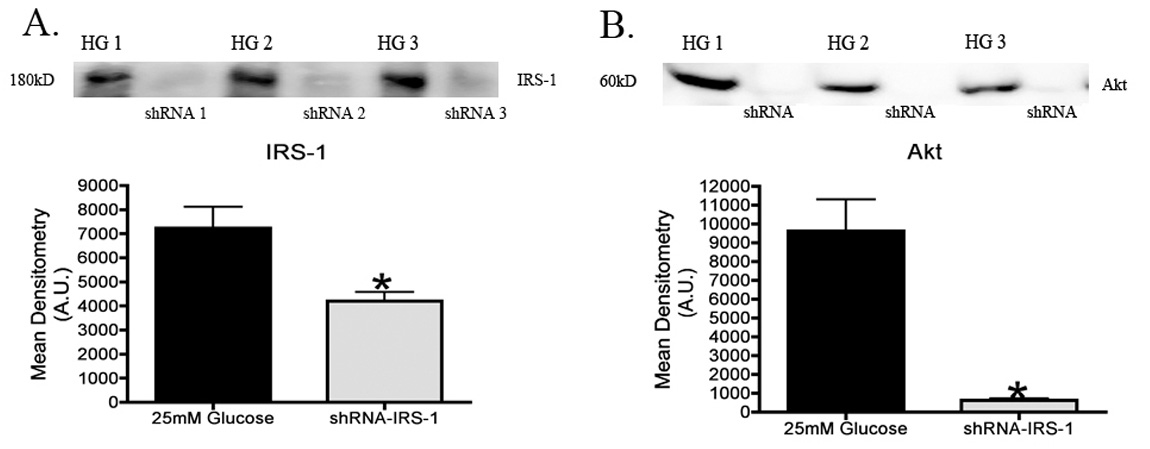
Figure 2. Verification of insulin receptor substrate (IRS)-1 shRNA knockdown. A: Mean densitometry and representative blot of IRS-1 levels following transfection of shRNA (IRS-1) in rat Müller cells. Mean densitometry was done for each blot which consisted of taking the mean optical densities of 4
different western blots for each protein analyzed. B: Mean Densitometry of Akt levels following transfection of shRNA (IRS-1) in Müller cells. Significance was determined by Mann–Whitney test (*p<0.05 versus 25 mM, n=5).

 Figure 2 of
Walker, Mol Vis 2012; 18:271-279.
  Figure 2 of
Walker, Mol Vis 2012; 18:271-279.