Figure 2. Expression pattern of proNGF in the rat retina A: Representative images show a similar spatial expression of GFP in retinas transduced with either pGFP or pGFP-proNGF123,
indicating successful transduction and incorporation of the plasmid after electroporation (ELP; 400X magnification). B: Representative images show selectively increased proNGF expression in RGCs and the inner nuclear layer (INL) in rats injected
with proNGF as compared with pGFP controls (400X magnification). C: Full length representative of western blot (WB) from vitreous samples isolated from rats injected with proNGF as compared
with pGFP controls. Arrow indicates proNGF (32 kDa). D: WB analysis of retinal lysate showed similar GFP expression and significant increase in proNGF (32 kDa) expression in rats
electroporated with proNGF123 as compared with those electroporated with pGFP (n=4). The asterisk represents a significant
difference as compared with the control group at p<0.05. GCL, ganglion cell layer; IPL, inner plexiform layer; ONL, outer
nuclear layer; ROD, relative optic density.
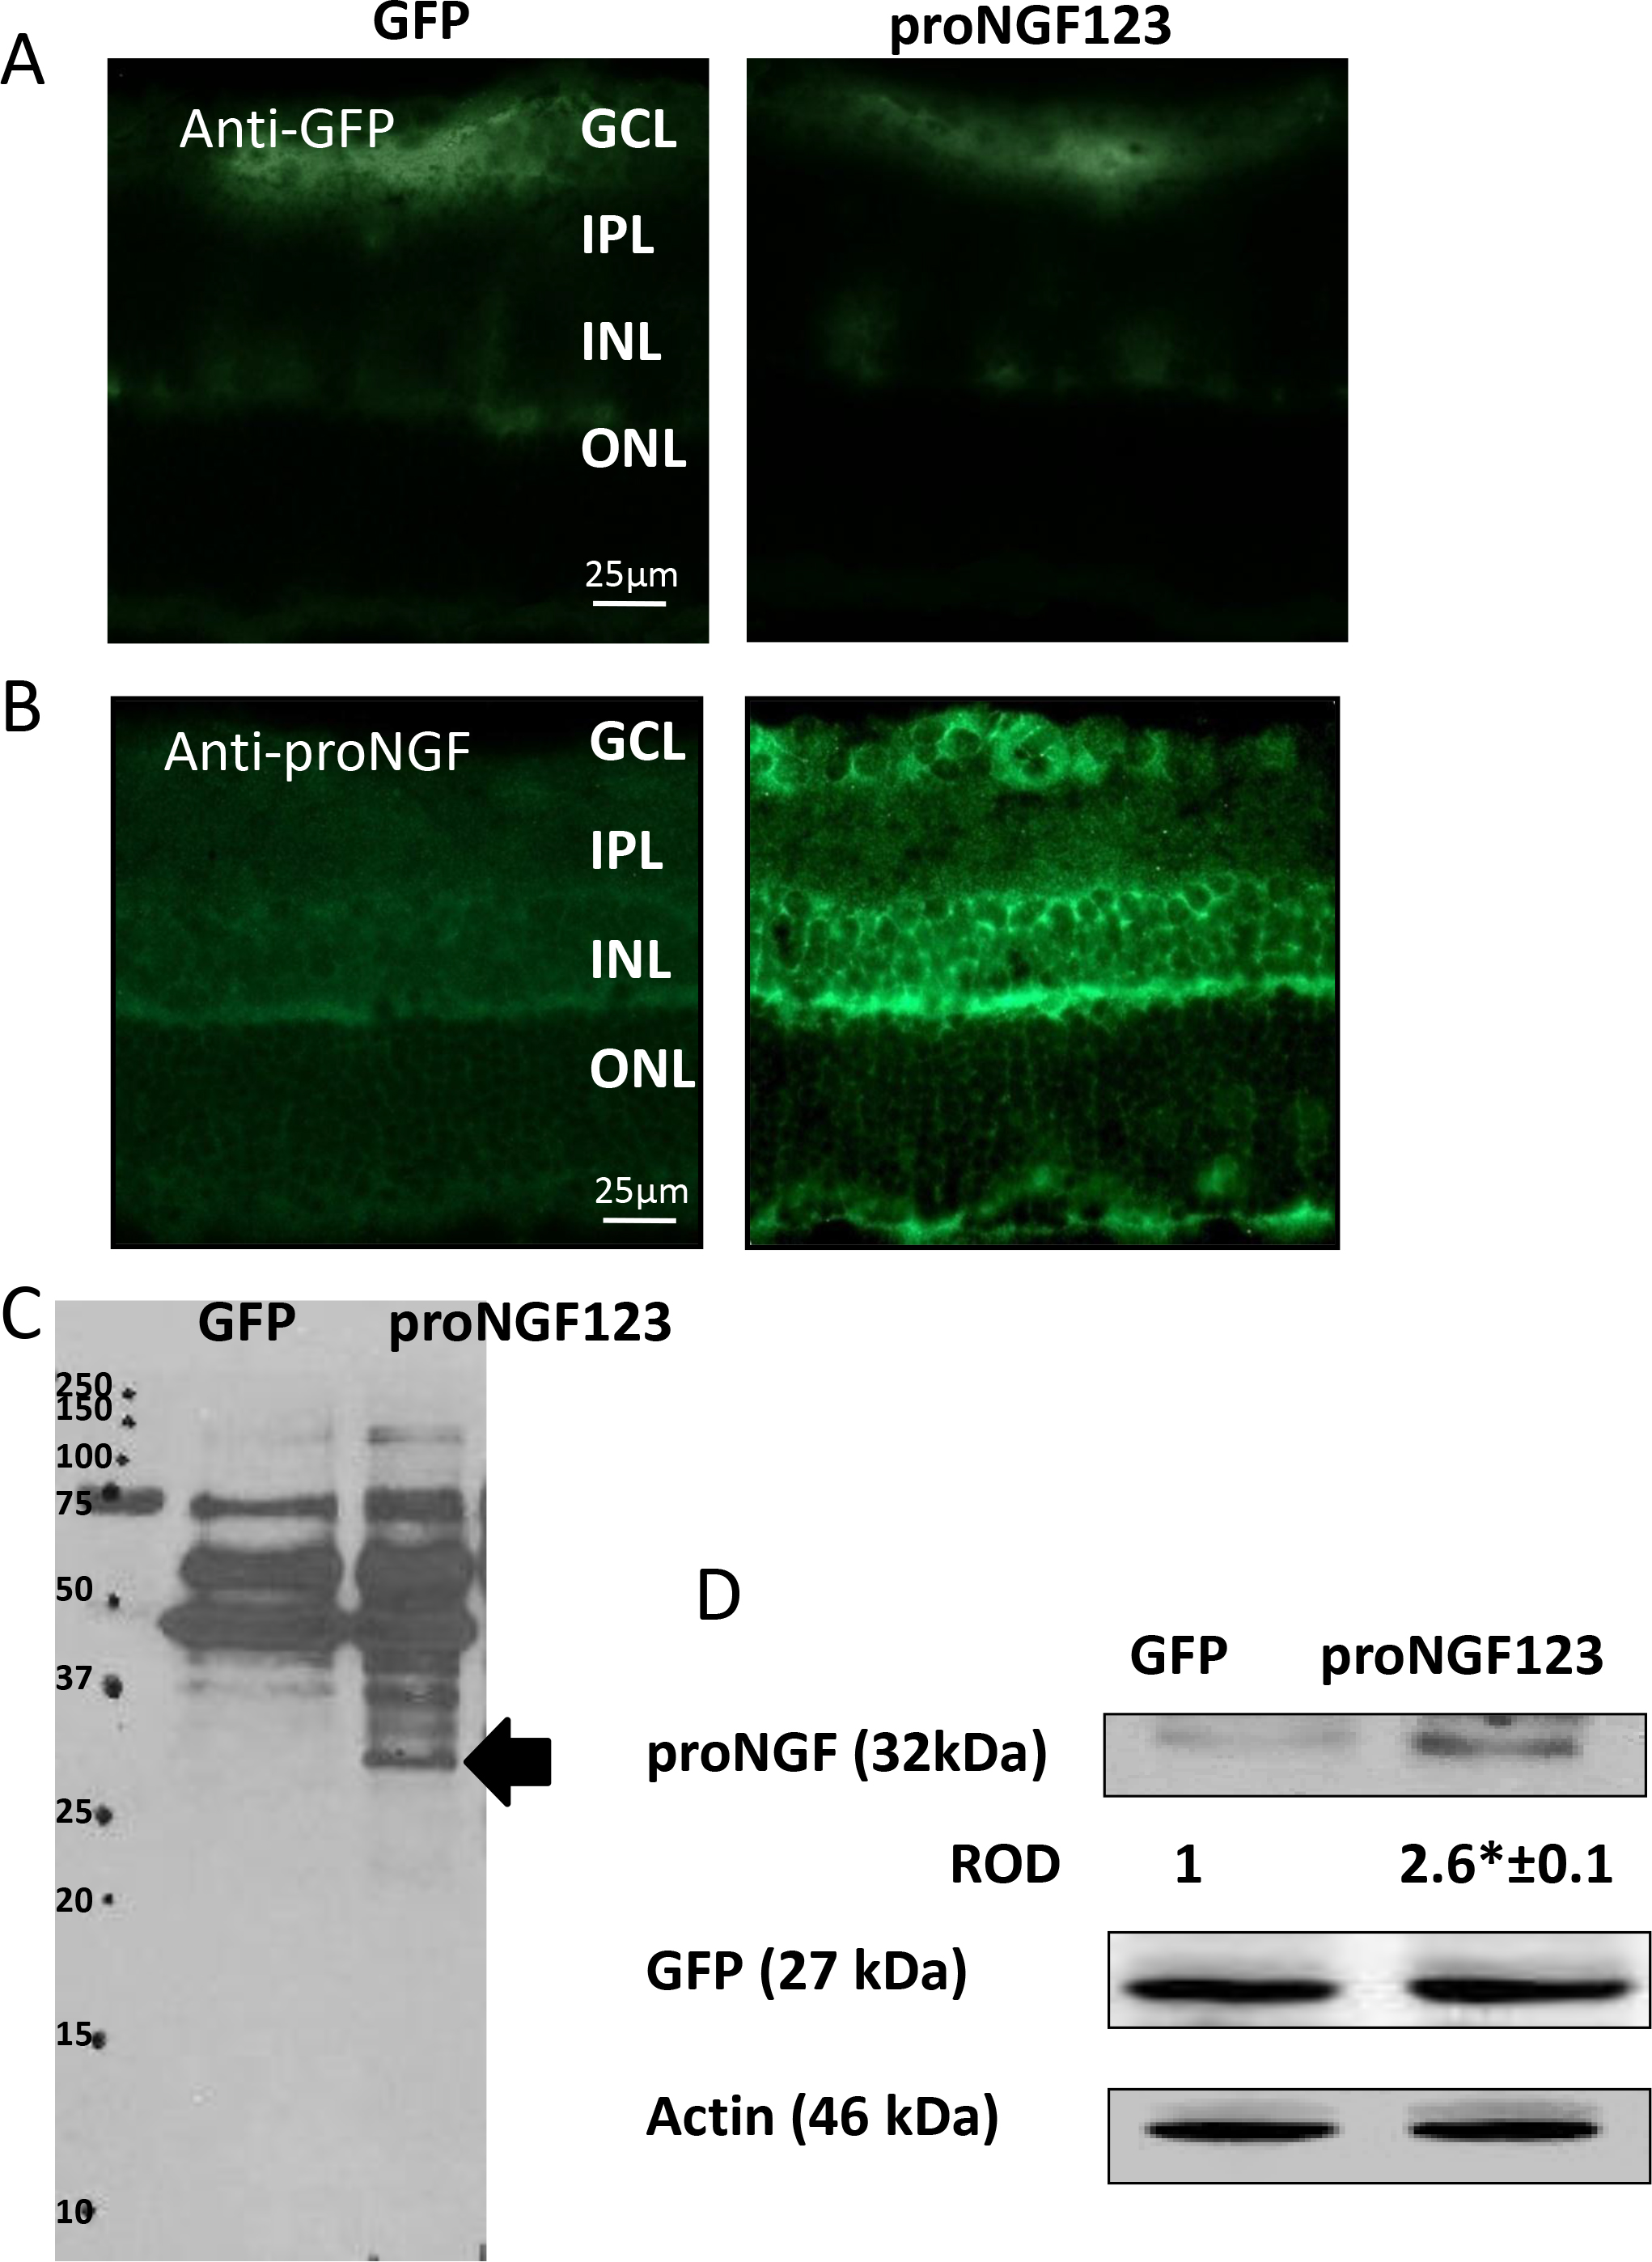
 Figure 2 of
Matragoon, Mol Vis 2012; 18:2993-3003.
Figure 2 of
Matragoon, Mol Vis 2012; 18:2993-3003.