Figure 1. Optimization of plasmid expression in the rat retina. A: Representative images show the wholemount retinas stained with anti-GFP (left panel, indicating successful incorporation
of the pGFP and pGFP-proNGF123 constructs in the retinas, indicated by the green fluorescence spots) and counterstained with
DAPI (right panel, 400X magnification). The transduction efficiency was calculated as the percentage of the number of GFPs
to the total number of nuclei in the whole retina (n=6). B: Statistical analysis showing changes in GFP transduction efficiency with different electroporation (ELP) settings. Four
different settings were used. The transduction efficiency was measured 7 days after ELP (n=6). C: The statistical analysis shows changes in GFP transduction efficiency with time and plasmid concentration. Two concentrations
of GFP plasmid were injected, specifically 1 µg/µl and 4 µg/µl. The transduction efficiencies were measured 3, 7, and 21 days
after ELP (n=6–8). * represents significant difference as compared with the rest of the groups at p<0.05.
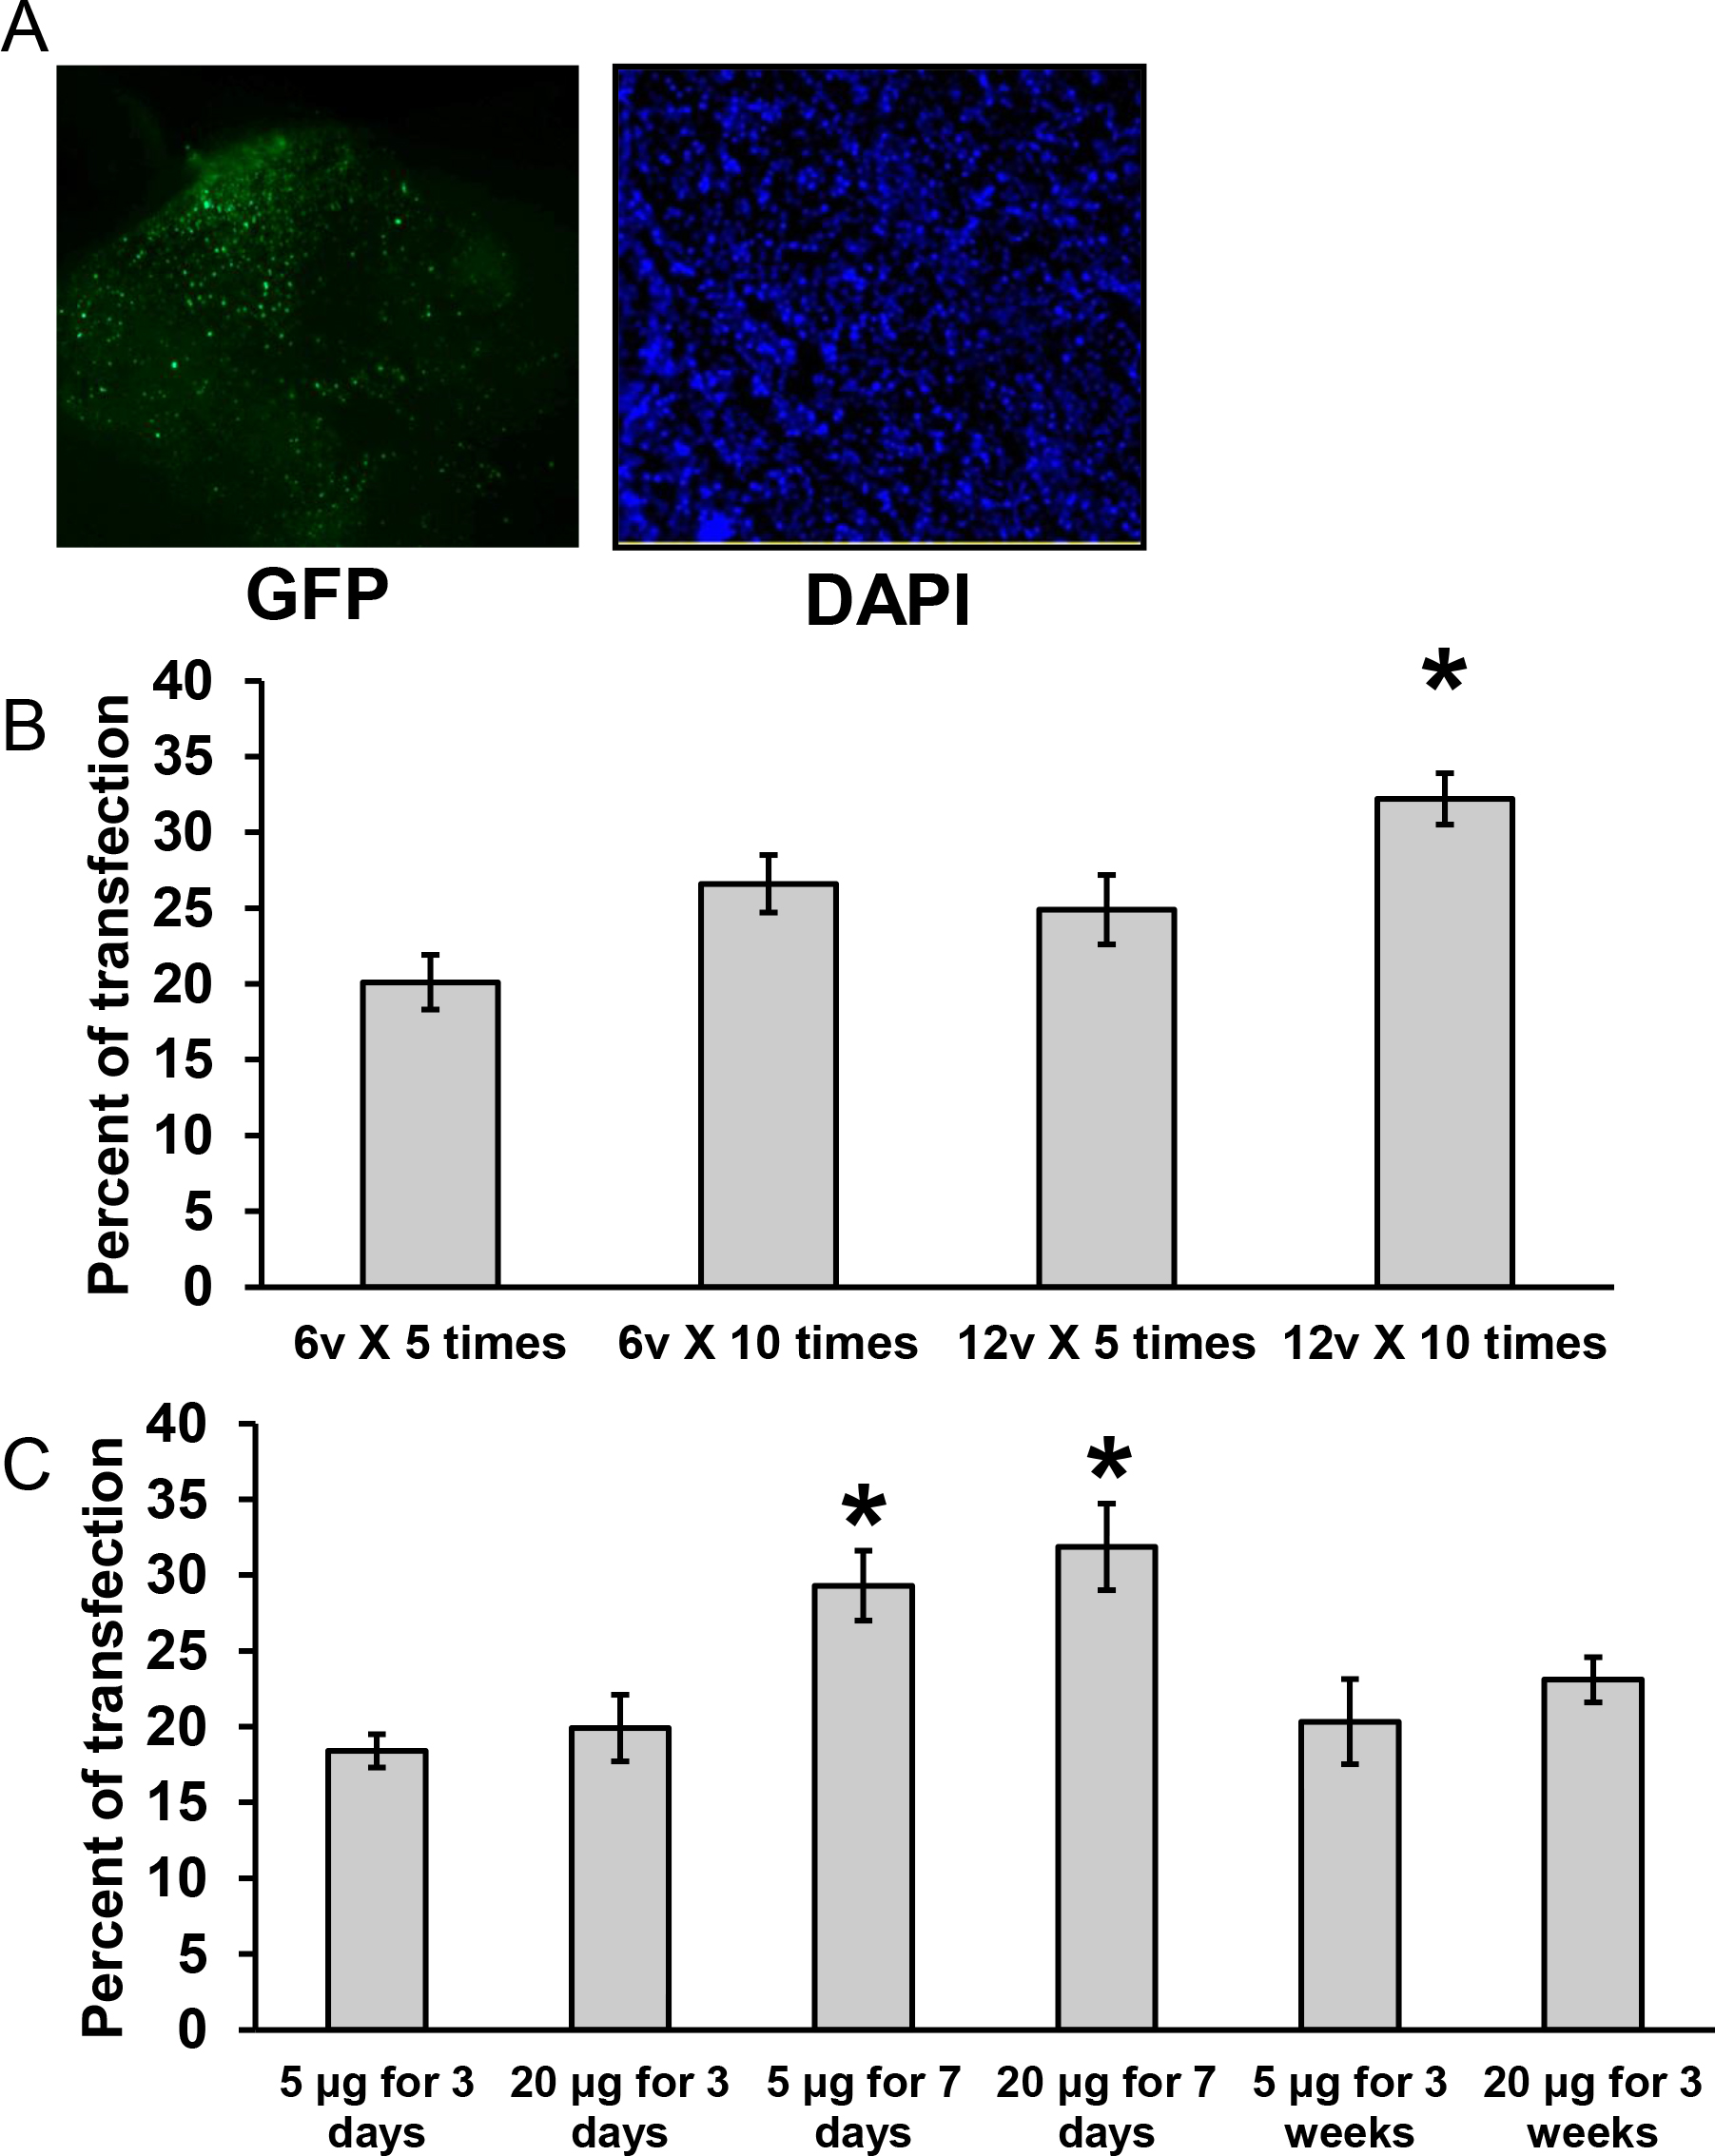
 Figure 1 of
Matragoon, Mol Vis 2012; 18:2993-3003.
Figure 1 of
Matragoon, Mol Vis 2012; 18:2993-3003.