Figure 5. Time-course of microglial chemotaxis in response to CCL2. Immunofluorescent images (A-I) showing the distribution of DAPI-labeled microglia that have passed through the membrane after 6, 10, and 24 h of CCL2 exposure
(200X). A, D, G: Primary microglia migrated to the lower surface of the chemotaxis chamber. B, E, H: GFP- expressing microglia migrated to the lower surface of the chemotaxis chamber. C, F, I: CCR2-GFP-expressing microglia migrated to the lower surface of the chemotaxis chamber. J. Quantification of the chemotactic response of various groups of microglia (CCR2- MG, GFP-MG and primary MG) at various time
points (6, 10, or 24 h) following CCL2 exposure (20 ng/ml). Each value corresponds to the mean ± SEM from nine random fields.
One-way ANOVA (*p<0.01) shows significant differences between CCR2-MG compared with GFP-MG and/or primary MG at the same time
points. Each experiment is representative of three independent experiments.
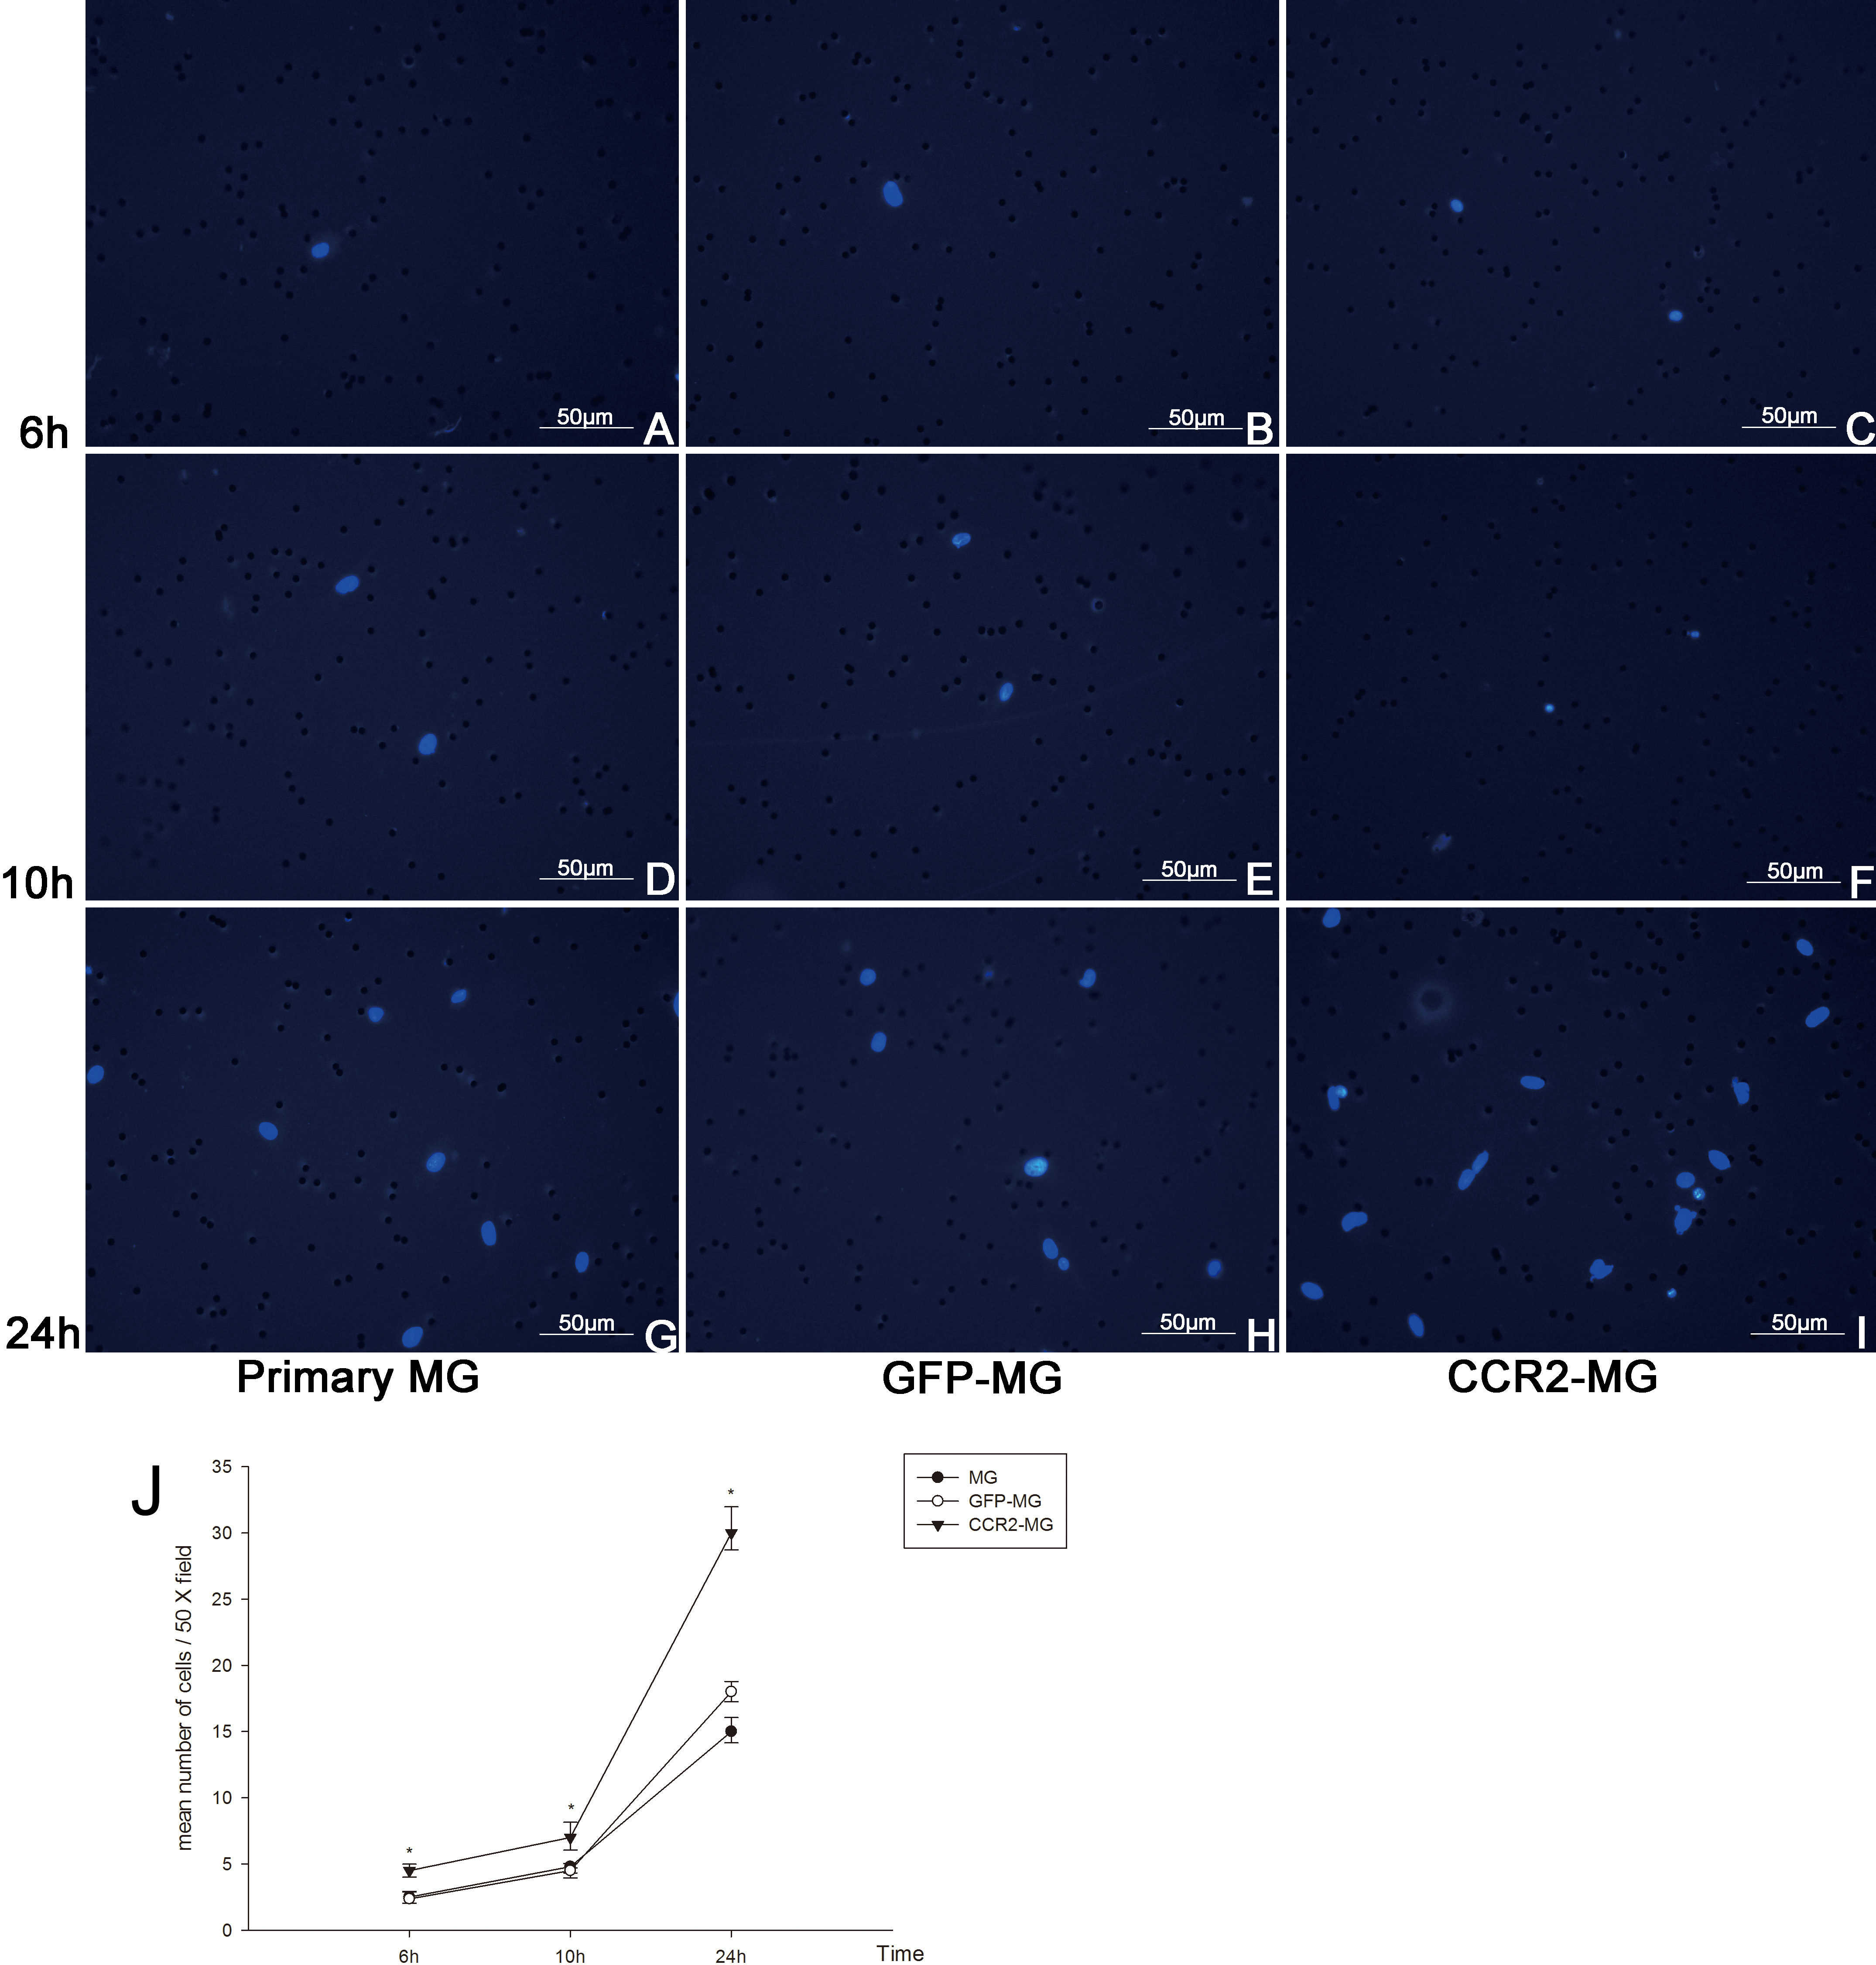
 Figure 5 of
Jiang, Mol Vis 2012; 18:2982-2992.
Figure 5 of
Jiang, Mol Vis 2012; 18:2982-2992.