Figure 4. Concentration-dependent chemotactic response of CC-chemokine receptor 2 (CCR2) -transduced microglia and control in response
to CC-chemokine ligand 2 (CCL2). Immunofluorescent images (A-H) showing the distribution of DAPI-labeled primary microglia (MG) and CCR2-GFP expressing microglia (CCR2-MG) that have passed
through the membrane toward the chamber containing CCL2 at concentrations ranging from 1 to 100 ng/ml after 24 h in culture
(200X). A-D: Primary microglia migrated to the lower surface of the chemotaxis chamber. E-H: CCR2-GFP-expressing microglia migrated to the lower surface of the chemotaxis chamber. I: Quantification of the chemotactic response of the various conditions of microglial cells (CCR2-MG, GFP-MG, and primary MG)
to increasing concentrations of CCL2. The number of transmigrated cells for each condition represents the chemotactic capacity.
Data represent the mean number of cells ±SEM from nine random fields. One-way ANOVA (*p<0.01) showed significant differences
in chemotactic response at CCL2 concentrations of 10, 20, and 100 ng/ml of CCL2, while CCL2 at 1 ng/ml was indistinguishable
from control (MG). J: Comparison of the chemotactic response of CCR2-MG, GFP-MG, and primary MG in the same conditions. The highest CCL2 concentration
elicited submaximal effects, while the CCL2 at 20 ng/ml elicited maximal effects after 24 h treatment. Each experiment is
representative of three independent experiments.
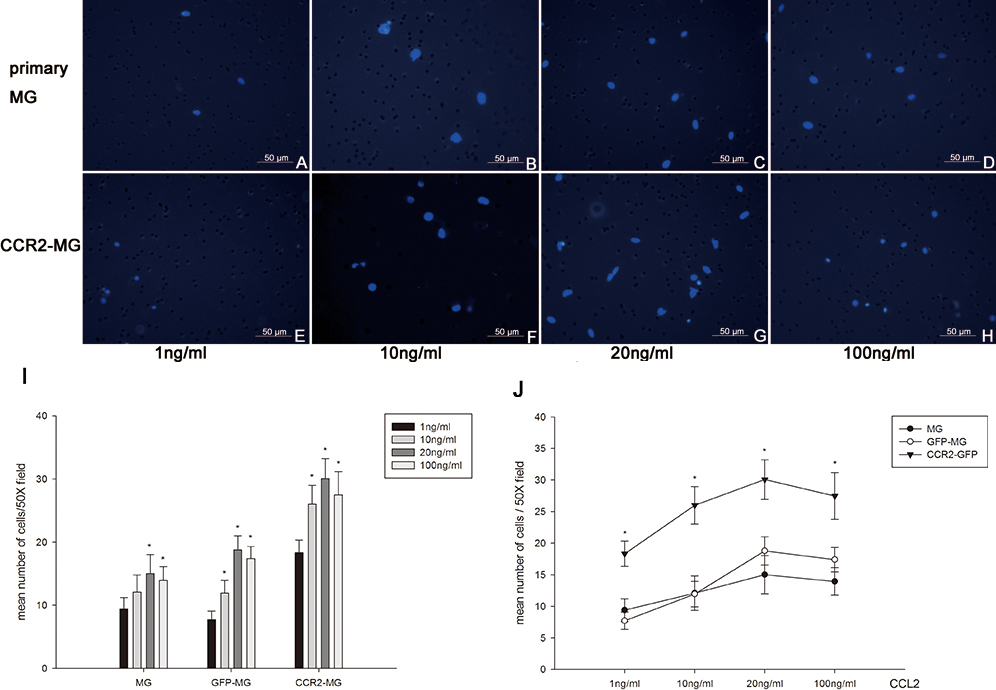
 Figure 4 of
Jiang, Mol Vis 2012; 18:2982-2992.
Figure 4 of
Jiang, Mol Vis 2012; 18:2982-2992.