Figure 10. Validation of the microarray gene expression profiles. The expression profiles of CDO1, GPR143, CHRNA3, RPE65, TYRP1, SFRP5, and CLDN19 were validated by comparing the microarray data with the gene expression data from real-time RT–PCR. Various profiles were
represented, and in each case, the data from the microarray analysis closely resembled the data generated by real-time RT–PCR.
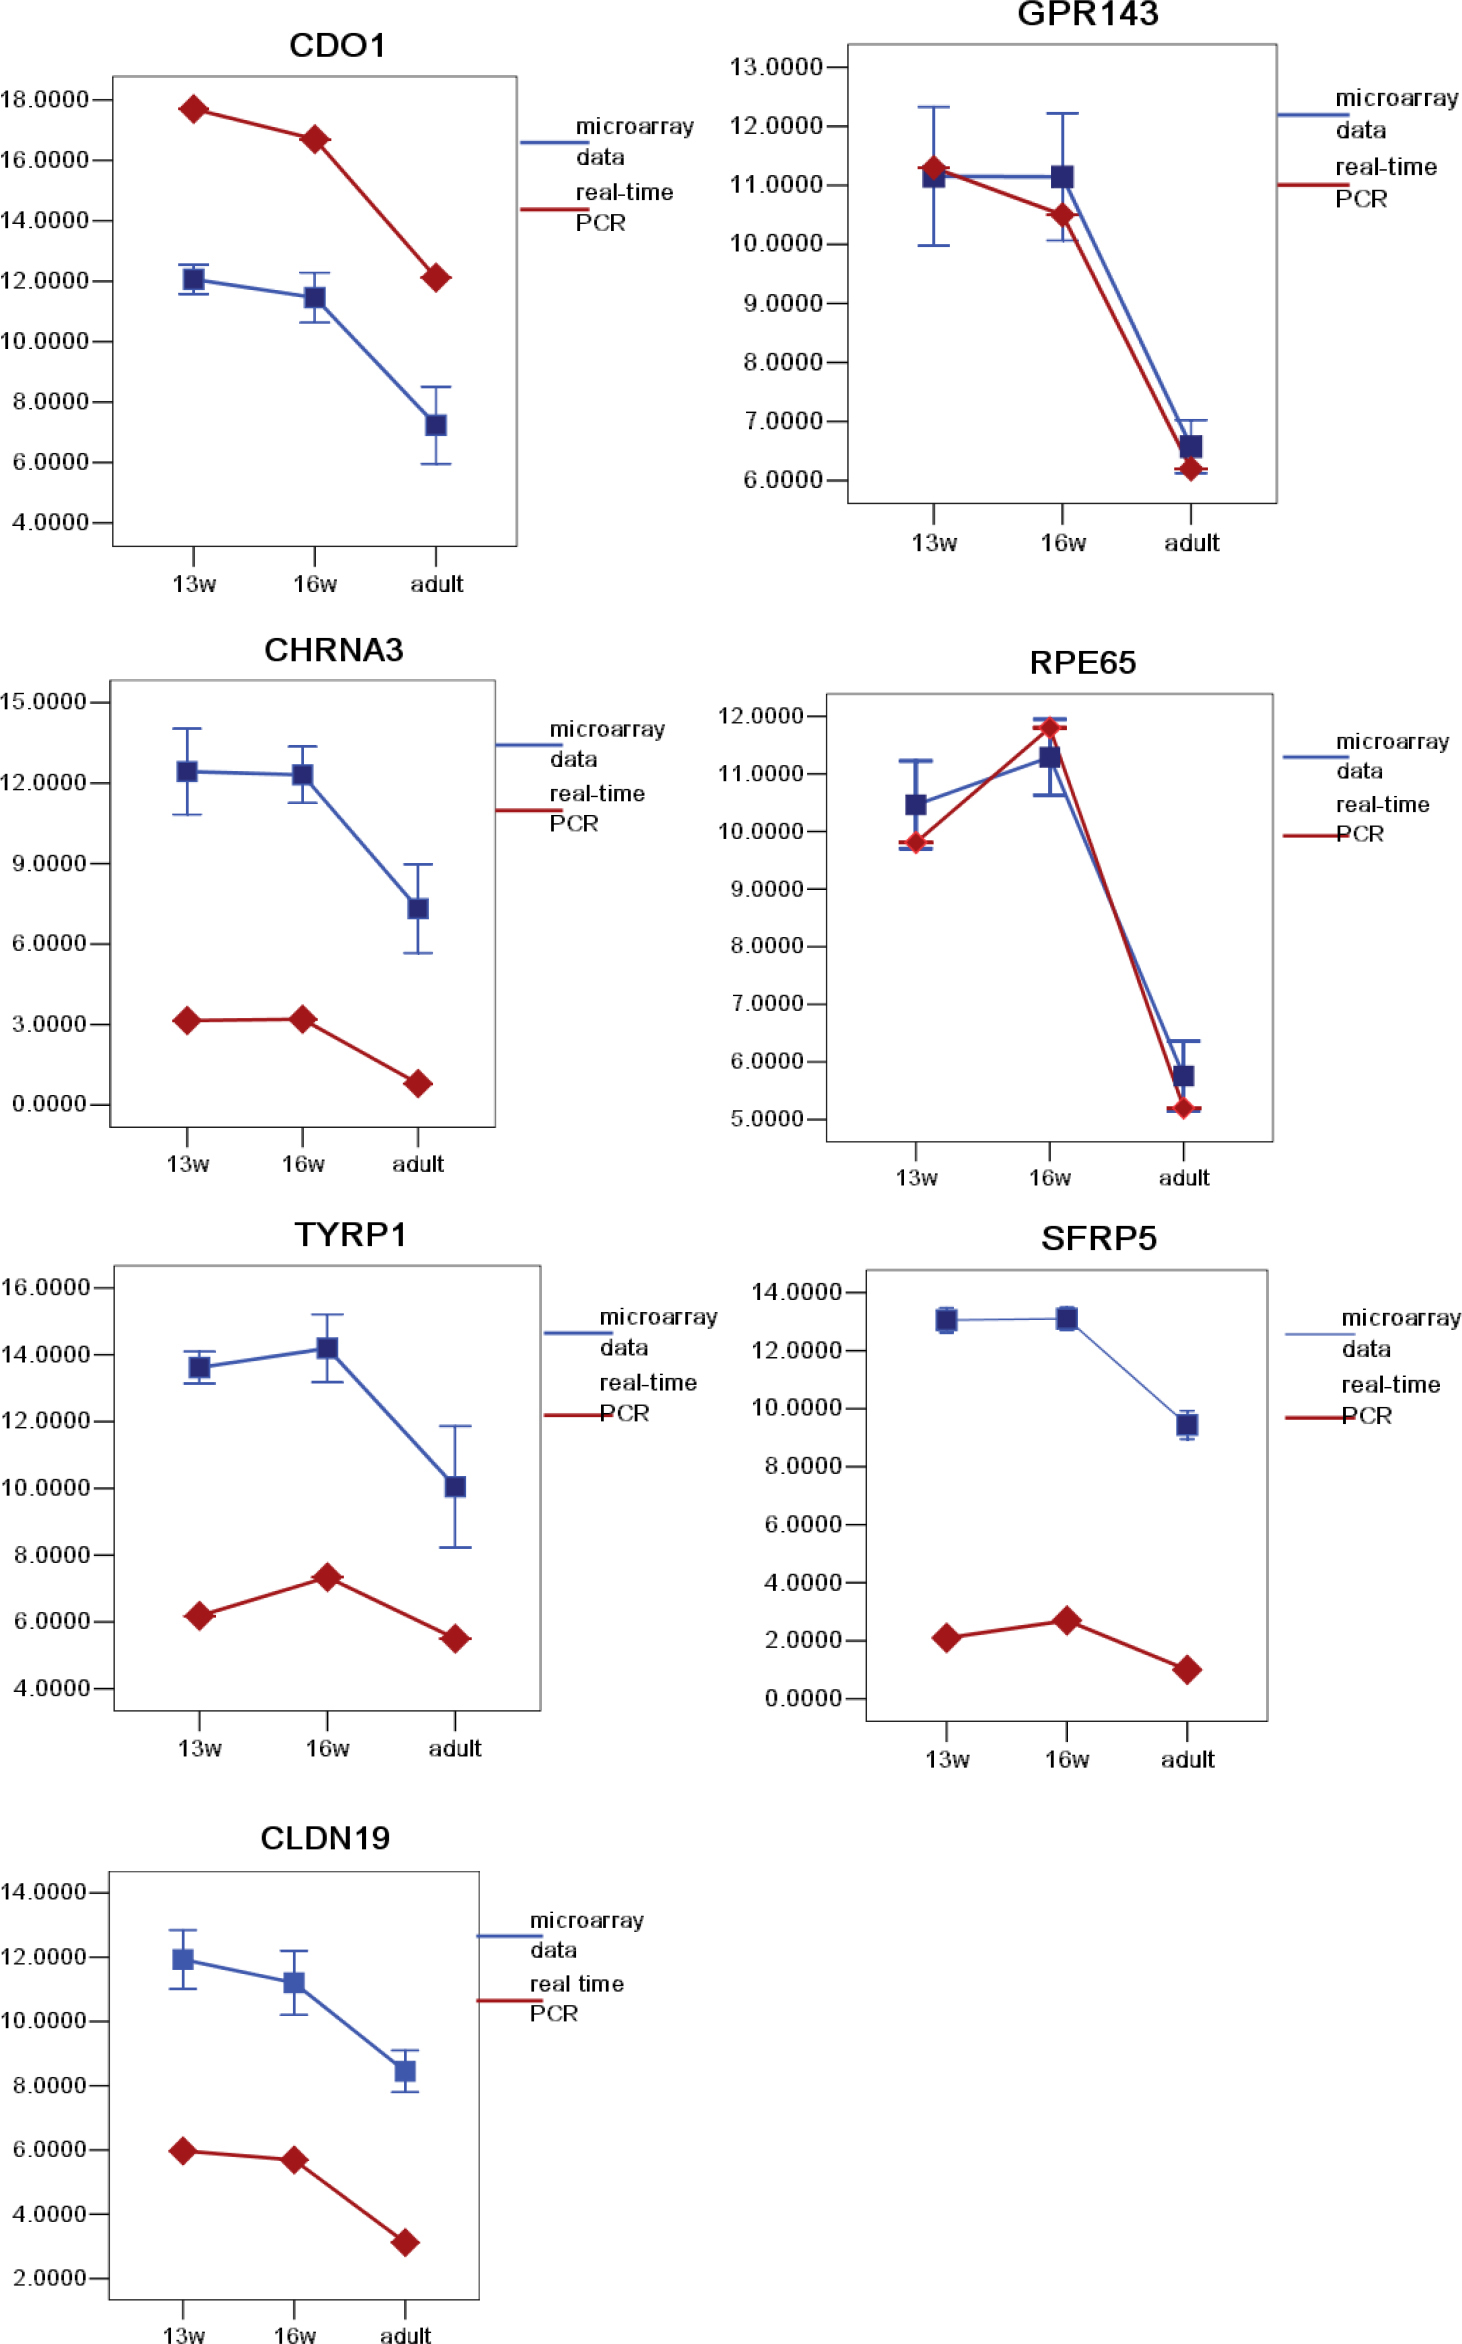
 Figure 10 of
Zhang, Mol Vis 2012; 18:2961-2975.
Figure 10 of
Zhang, Mol Vis 2012; 18:2961-2975.