Figure 1. Cluster analysis of differentially expressed genes. Probe sets were grouped by STEM software into eight clusters that were
statistically significant. The notations “13 w,” “16 w,” and “adult” on the x-axis represent different time points. The numbers
at the upper right indicate the number of genes belonging to each cluster and the p value significance.
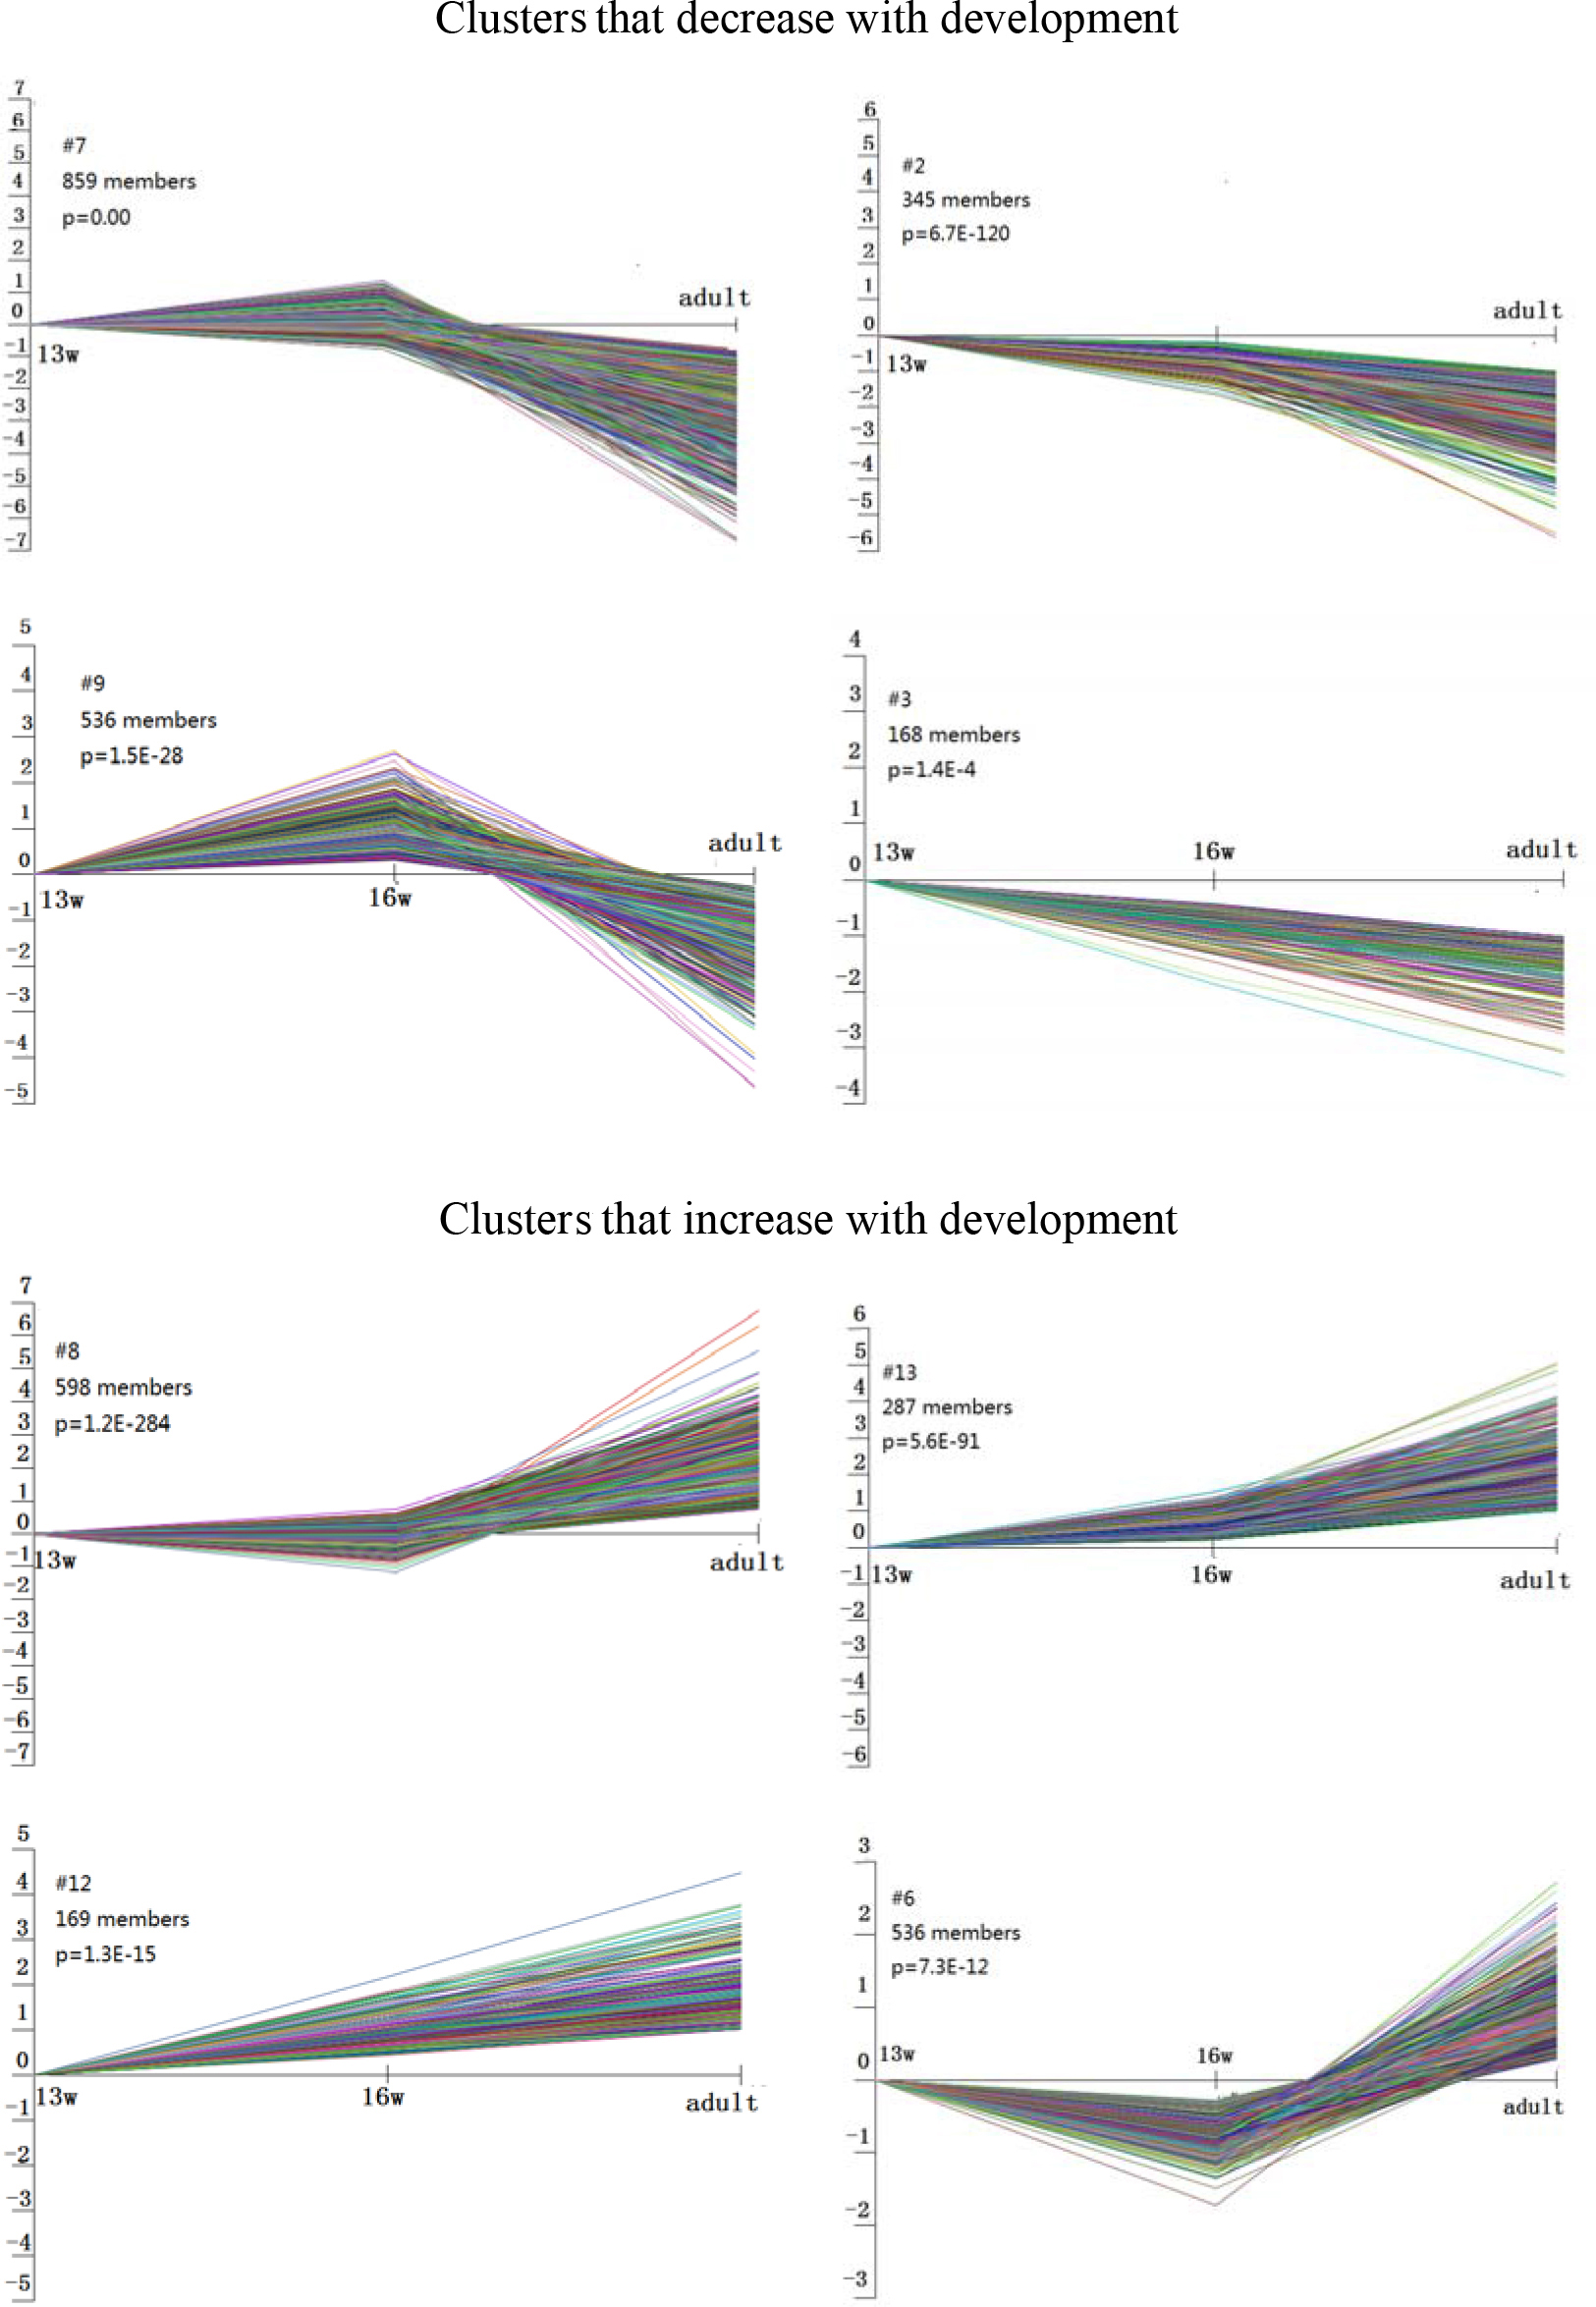
 Figure 1 of
Zhang, Mol Vis 2012; 18:2961-2975.
Figure 1 of
Zhang, Mol Vis 2012; 18:2961-2975.