Figure 3. The caspase-3 and vascular endothelial growth factor (VEGF) gene expression in corneas after ARF1 inhibitor local administration.
A: Representative reverse transcription polymerase chain reaction (RT–PCR) of caspase-3 and VEGF expression 1 and 2 weeks after
ARF1 inhibitor-treated and control group are shown. B and C: The relative levels of caspase-3 and VEGF gene expression to GAPDH were determined. All values represent mean±standard error
of the mean (SEM) of three independent measurements (*p<0.05 versus 0.2% HA).
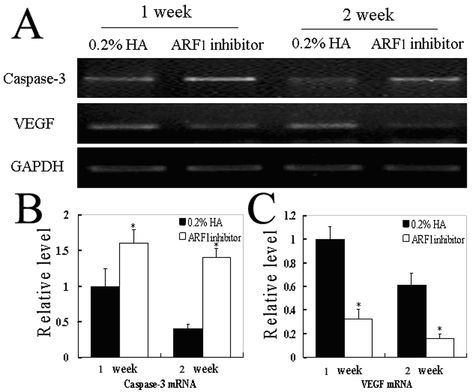
 Figure 3 of
Dai, Mol Vis 2012; 18:2947-2953.
Figure 3 of
Dai, Mol Vis 2012; 18:2947-2953.