Figure 2 of
AlFadhli, Mol Vis 2012; 18:2931-2936.
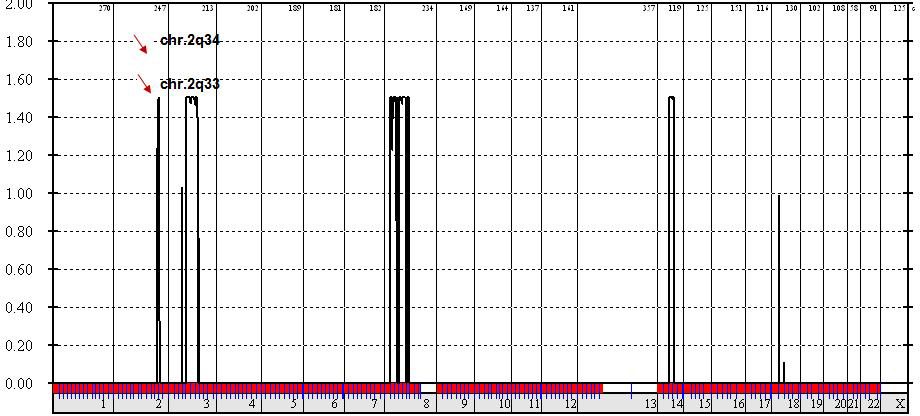
Figure 2.
Whole genome linkage analysis. The results show the highest logarithm of odds (LOD) score regions, Chr.2q34 and Chr.2q33, spanning the crystalline beta A2 (
CRYGB A2
) and crystallin gamma (
CRYG
) gene cluster.
 Figure 2 of
AlFadhli, Mol Vis 2012; 18:2931-2936.
Figure 2 of
AlFadhli, Mol Vis 2012; 18:2931-2936.