Figure 9. Quantitative data of real-time reverse transcription polymerase chain reaction (RT-PCR) for glial fibrillary acidic protein
(GFAP) and syntaxin 1. A relative RNA ratio was calculated by dividing the value of each purification method by the value
of whole retinal cell suspension. Data were expressed as the mean±SEM. (n=9 for each method). The p value for GFAP and syntaxin
1 was 0.021* and 0.022**, respectively.
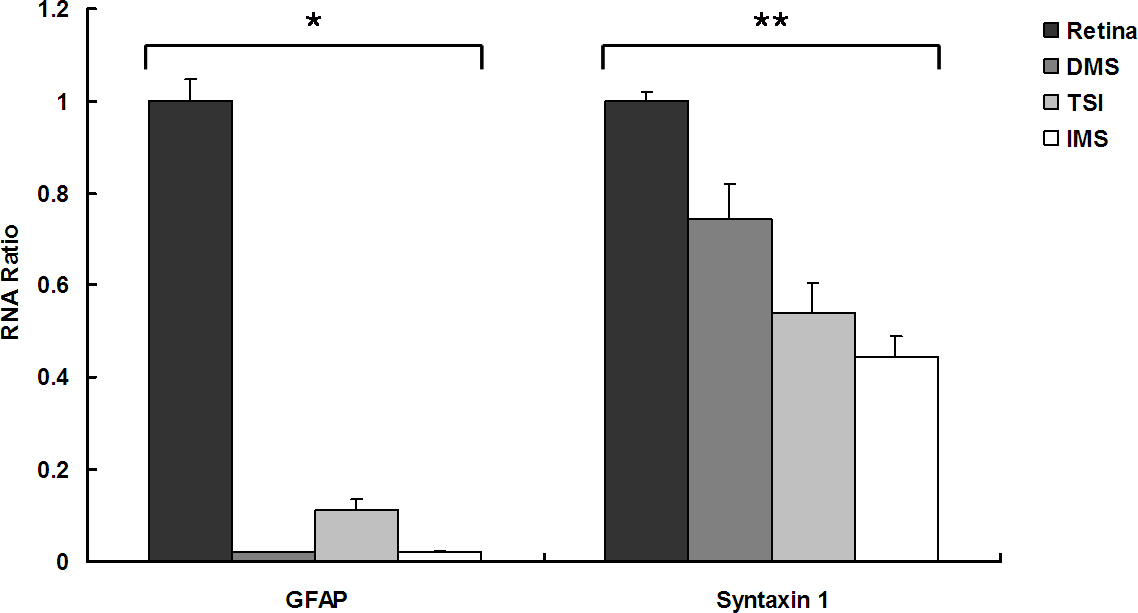
 Figure 9 of
Hong, Mol Vis 2012; 18:2922-2930.
Figure 9 of
Hong, Mol Vis 2012; 18:2922-2930.