Figure 5. Assessment of retinal ganglion cells (RGCs) in σR1 knockout (σR1-KO) and wild-type (WT) diabetic (DB) and non-diabetic mice
(non-DB). Retinal cryosections were prepared from WT (non-DB), WT-DB, σR1 KO (non-DB), and σR1 KO–DB mice after 12 weeks of
diabetes and subjected to immunohistochemistry. A: RGCs were labeled with Brn3a (green fluorescence) and nuclei were labeled with DAPI (blue). B: The numbers of Brn3a positive cells were counted and expressed per unit length of retina. C: Red and blue fluorescent signals reflect cleaved caspase-3 and DAPI staining of nuclei, respectively. The calibration bar
in panels A and C=20 μm. Statistical differences between groups is denoted with an asterisk (*, p<0.05).
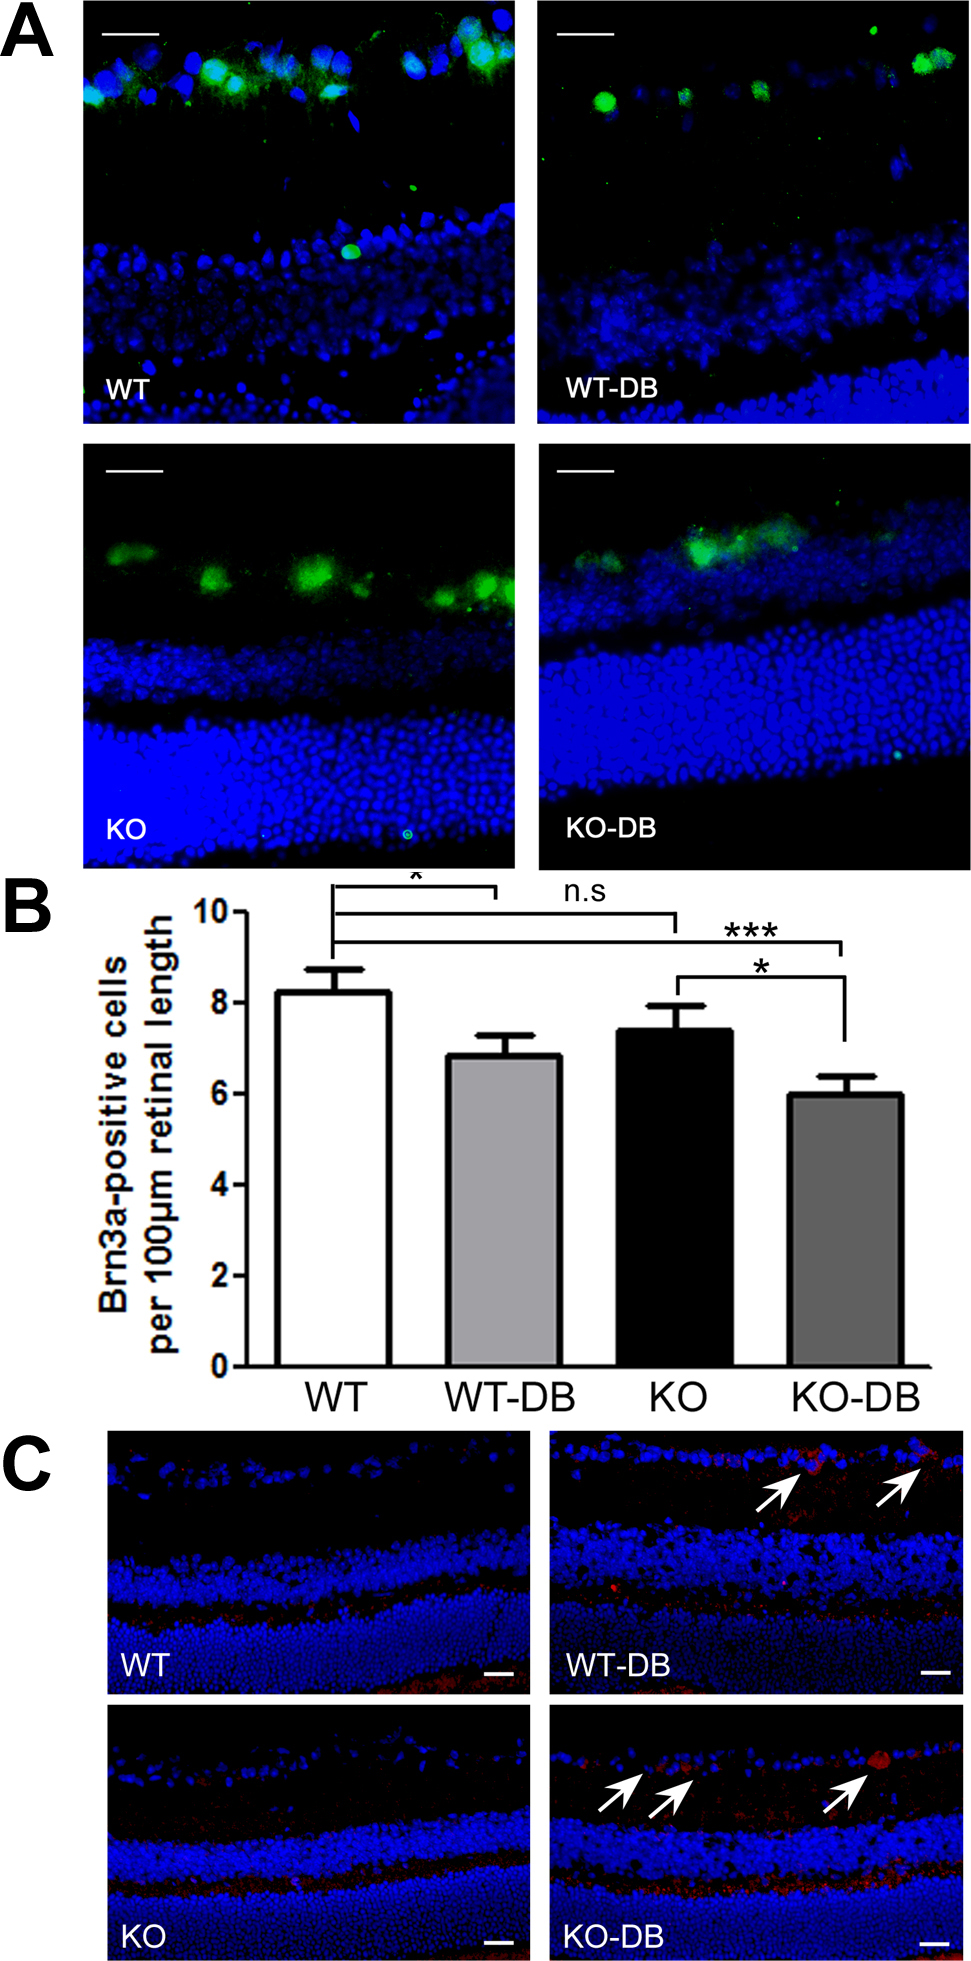
 Figure 5 of
Ha, Mol Vis 2012; 18:2860-2870.
Figure 5 of
Ha, Mol Vis 2012; 18:2860-2870.