Figure 4. Negative scotopic threshold responses. Electrophysiologic analysis was performed after 12 weeks of diabetes. Under scotopic
conditions, responses to a range of dim flash intensities were recorded. Means and standard errors averaged over 10 mice per
group are shown across intensities given in log scotopic troland-seconds. Gaussian fits to the results for each group are
shown. The peaks, and their estimated standard errors, of these Gaussians are compared in the inset, with the significance
(t test *, p<0.05) of the differences indicated.
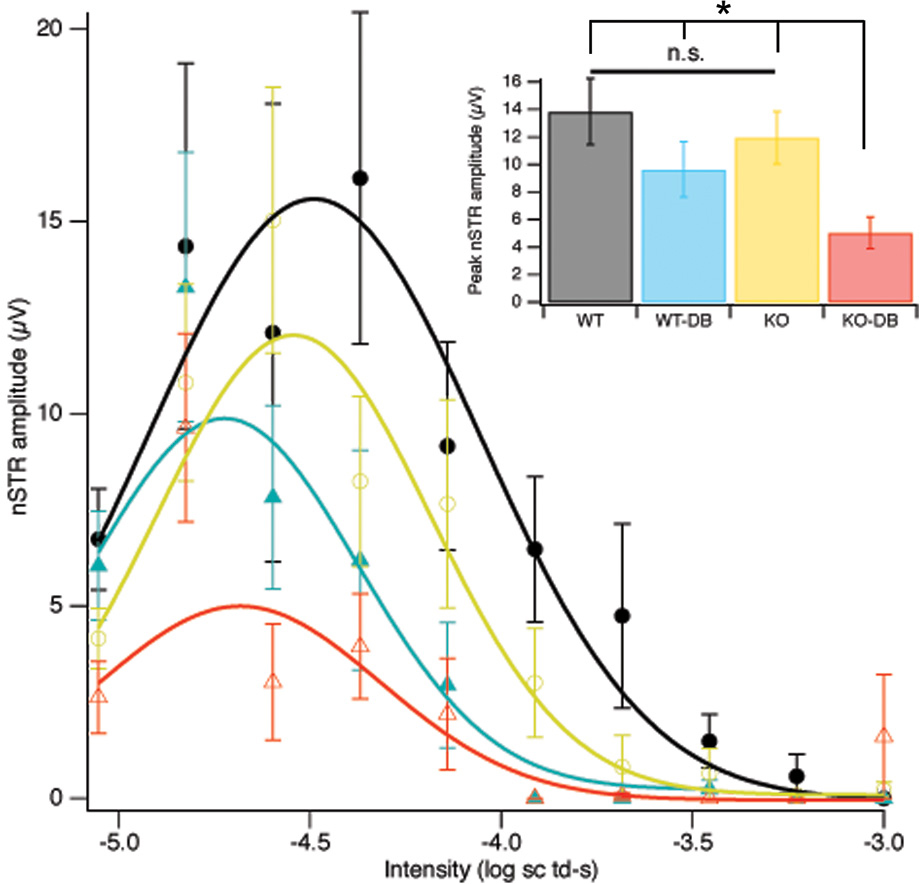
 Figure 4 of
Ha, Mol Vis 2012; 18:2860-2870.
Figure 4 of
Ha, Mol Vis 2012; 18:2860-2870.