Figure 3. Intraocular pressure. Intraocular pressure (IOP) was measured in wild-type, non-Diabetic (WT-DB), Wild-type-diabetic (WT-DB),
σR1 knockout non-diabetic (σR1 KO non-DB), and σR1 knockout diabetic (σR1 KO-DB) mice during the day (A) and night (B) after 12 weeks of diabetes. Data represent averaged values for the mice in the four groups (n=10 mice tested per group;
the asterisks denote between which groups there are significant statistical differences: *, p<0.05; **, p<0.01; ***, p<0.001).
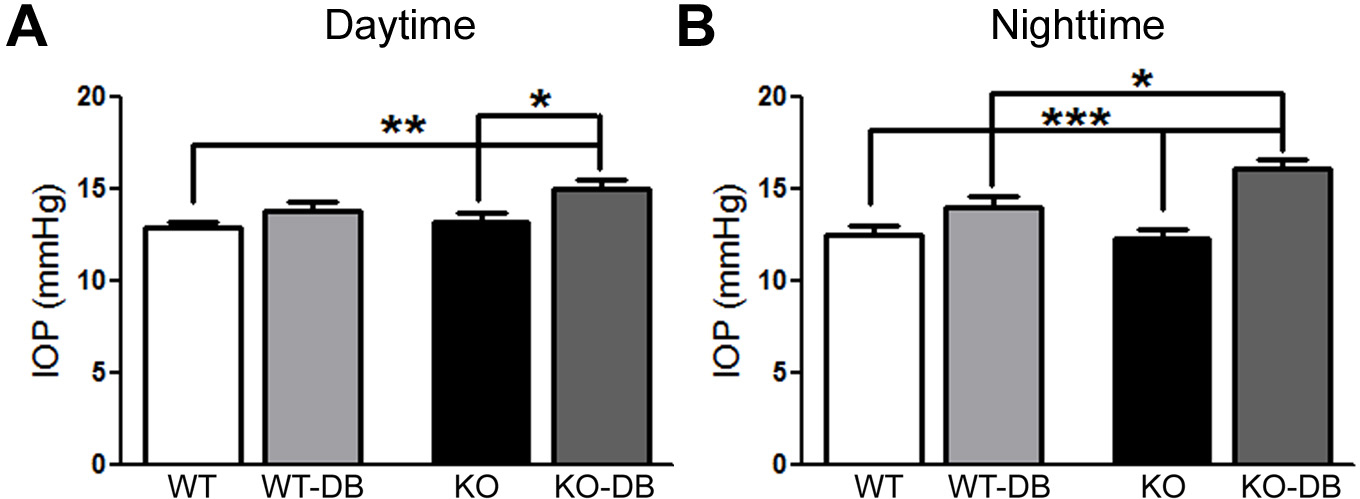
 Figure 3 of
Ha, Mol Vis 2012; 18:2860-2870.
Figure 3 of
Ha, Mol Vis 2012; 18:2860-2870.