Figure 5. The inhibitory effect of 15-LOX-1 overexpression on retinal neovascularization in the oxygen-induced ischemic retinopathy
model. The experiments were divided into the oxygen-induced retinopathy treated with adenoviral-15-lipoxygenase-1 group (the
15-LOX-1 group), the untreated oxygen-induced retinopathy group (the OIR group), the oxygen-induced retinopathy treated with
adenoviral-green fluorescence protein group (the GFP group) and the normal control group (the normal group), with four mice
per experimental group. All mice were perfused with fluorescein isothiocyanate-dextran at postnatal day 17 and the retina
flatmounted. The images were representatives the retinal angiographs from the eyes of 15-LOX-1 group (A), OIR group (B), GFP group (C) and Normal group (D). The magnification of A-D is 40×. The red rectangles in each figure are the magnification of randomly selected foci of retina, and the red arrows indicate
the neovascular tufts. E: Retinas neovascular areas were measured and compared with the 15-LOX-1 group, OIR group, GFP group and normal group mice.
Retinal neovascularization was quantified by measuring the ratio of the neovascular tuft area to the total retinal area using
Image-Pro Plus 6.0 software (means±SD, n=8), 15-LOX-1 group versus OIR group *p<0.05, n=8; 15-LOX-1 group versus GFP group
**p<0.05, n=8. F: Retinas non-perfusion areas were measured and compared with 15-LOX-1 group, OIR group, GFP group and Normal
group using Image-Pro Plus 6.0 software (means±SD, n=8), 15-LOX-1 group versus OIR group *p<0.05, n=8; 15-LOX-1 group versus
GFP group **p<0.05, n=8.
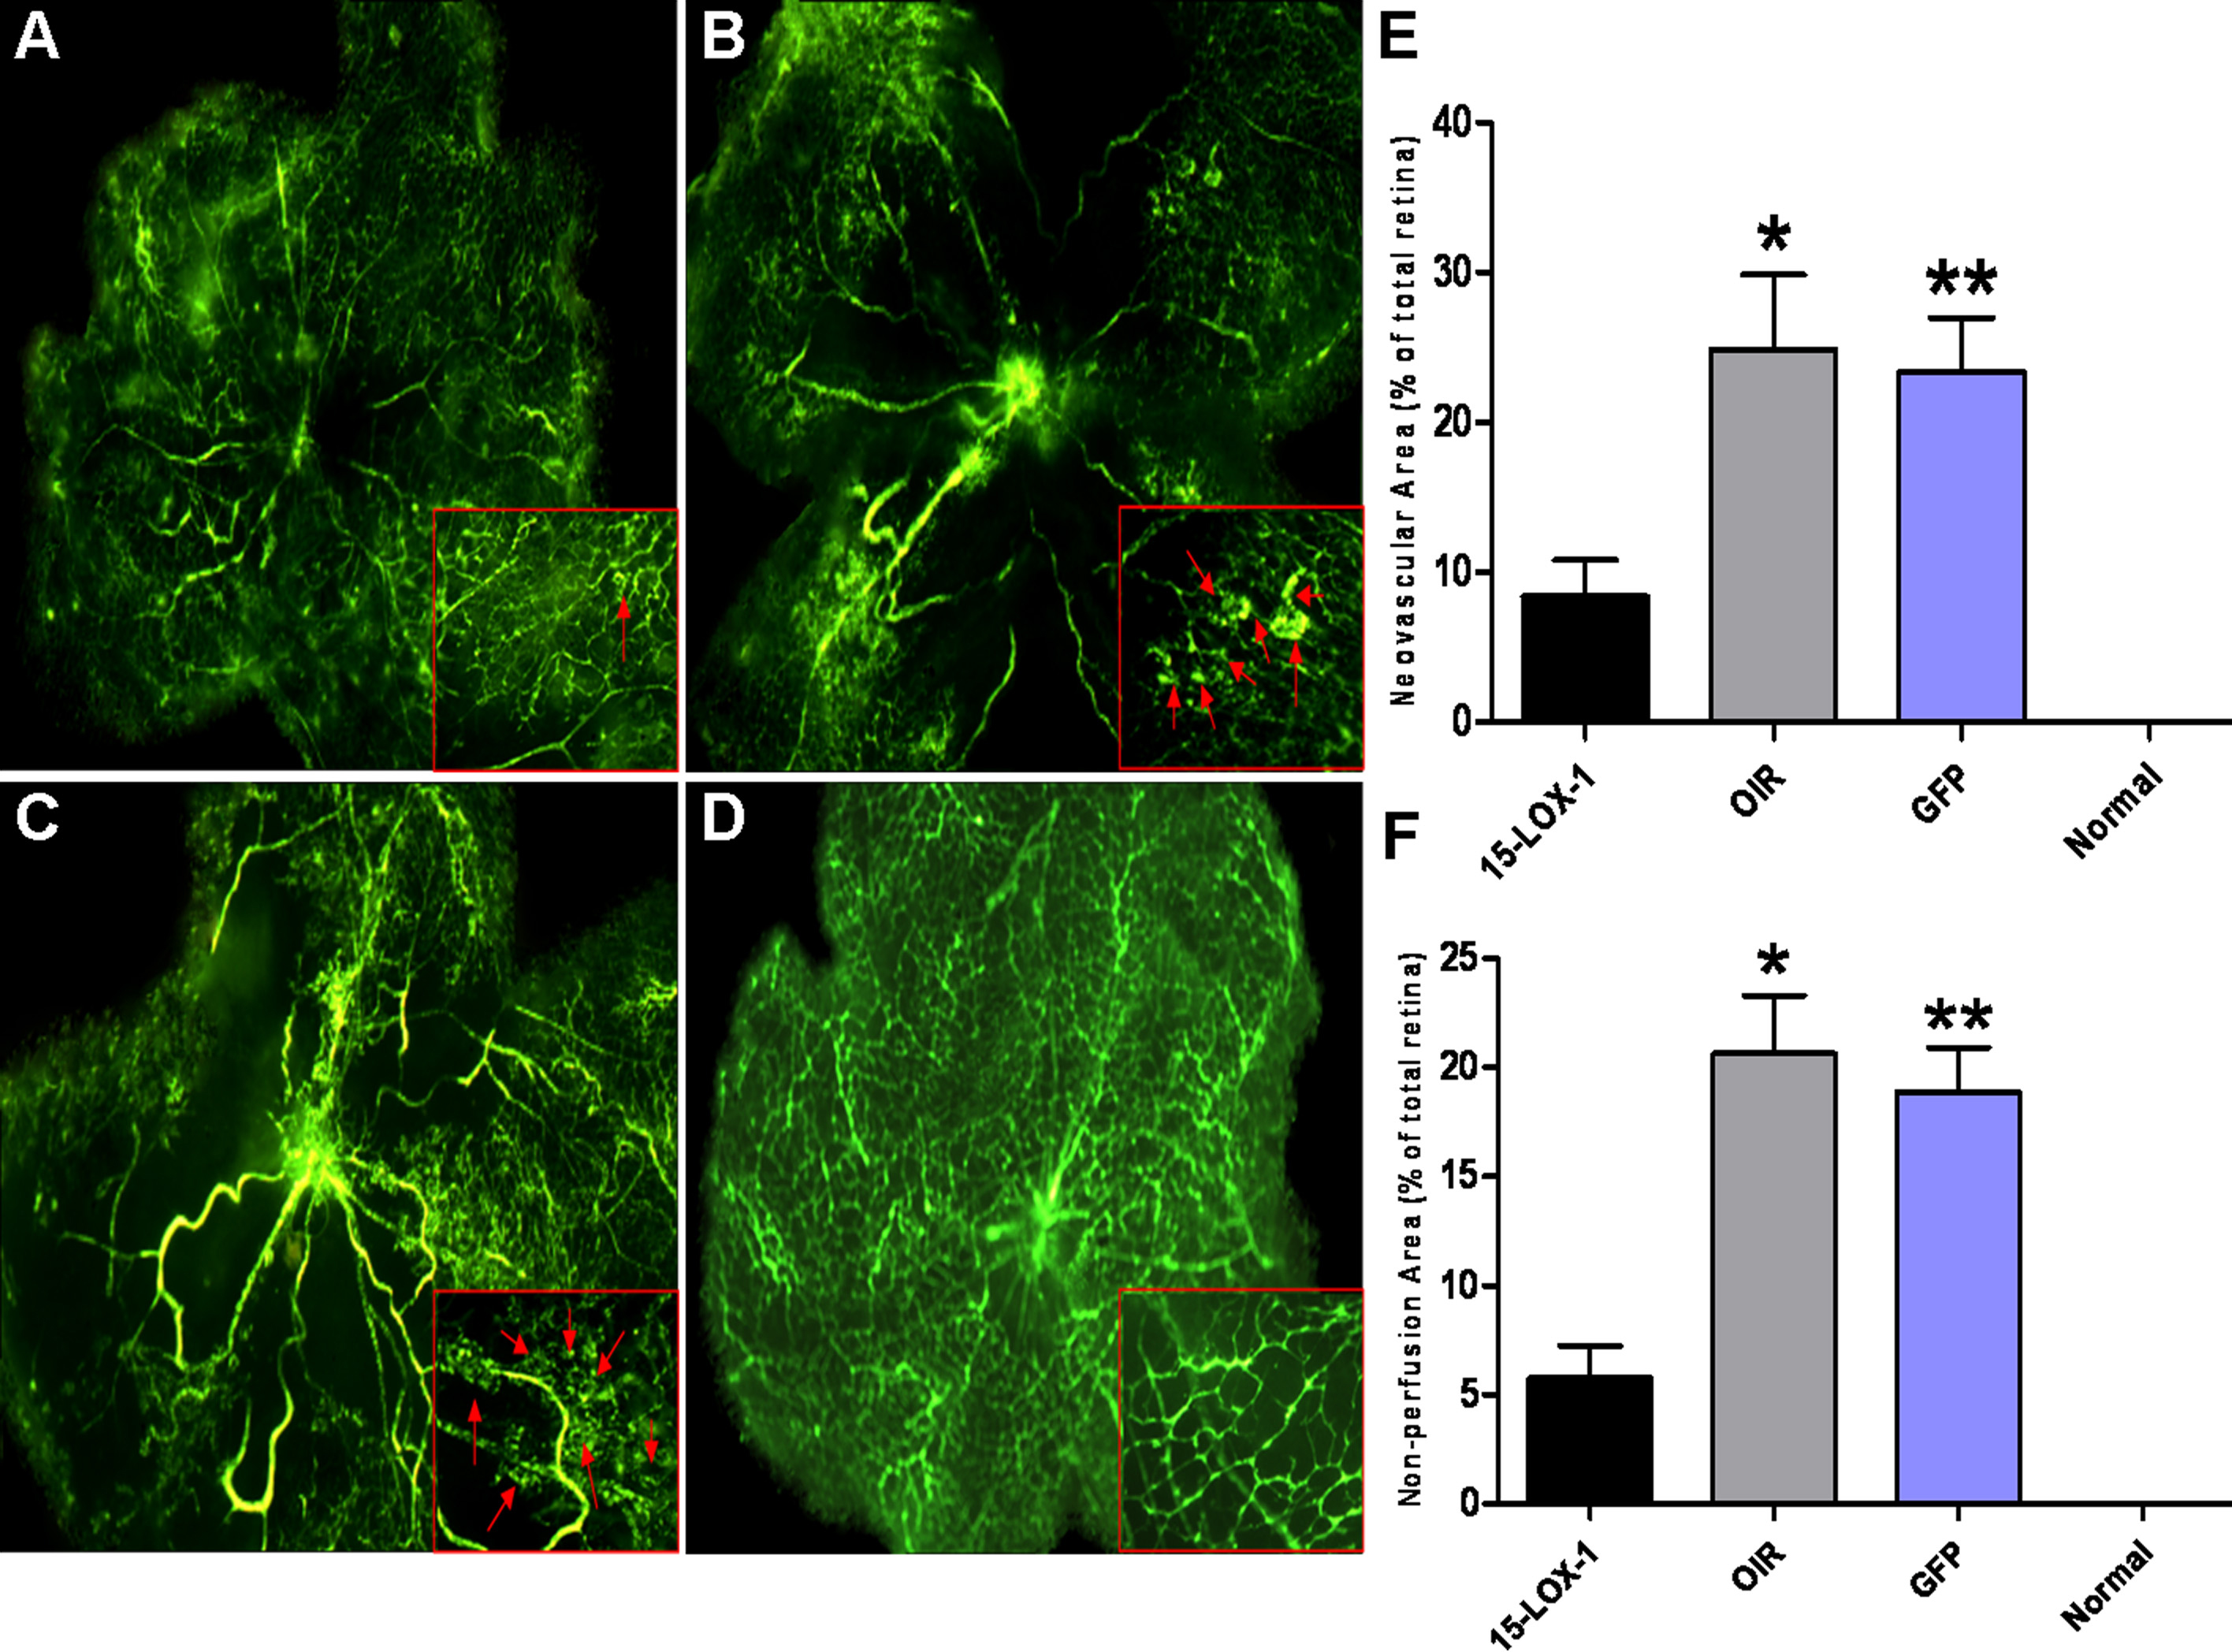
 Figure 5 of
Li, Mol Vis 2012; 18:2847-2859.
Figure 5 of
Li, Mol Vis 2012; 18:2847-2859.