Figure 4. Real-time PCR analysis confirmed overexpression of 15-LOX-1. The experiments were divided into the oxygen-induced retinopathy
treated with adenoviral-15-lipoxygenase-1 group (the 15-LOX-1 group), the untreated oxygen-induced retinopathy group (the
OIR group), the oxygen-induced retinopathy treated with adenoviral-green fluorescence protein group (the GFP group) and the
normal control group (the normal group), with three mice per experimental group. Real-time PCR analysis showed that the mRNA
expression levels of 15-LOX-1 in the 15-LOX-1 group were higher than those in the OIR group, the GFP group, and the normal
group. Data are shown as means±SD; the relative amount of mRNA was normalized to β-actin. 15-LOX-1 group versus OIR group
*p<0.05, n=3; 15-LOX-1 group versus GFP group **p<0.05, n=3; 15-LOX-1 group versus Normal group ***p<0.05, n=3.
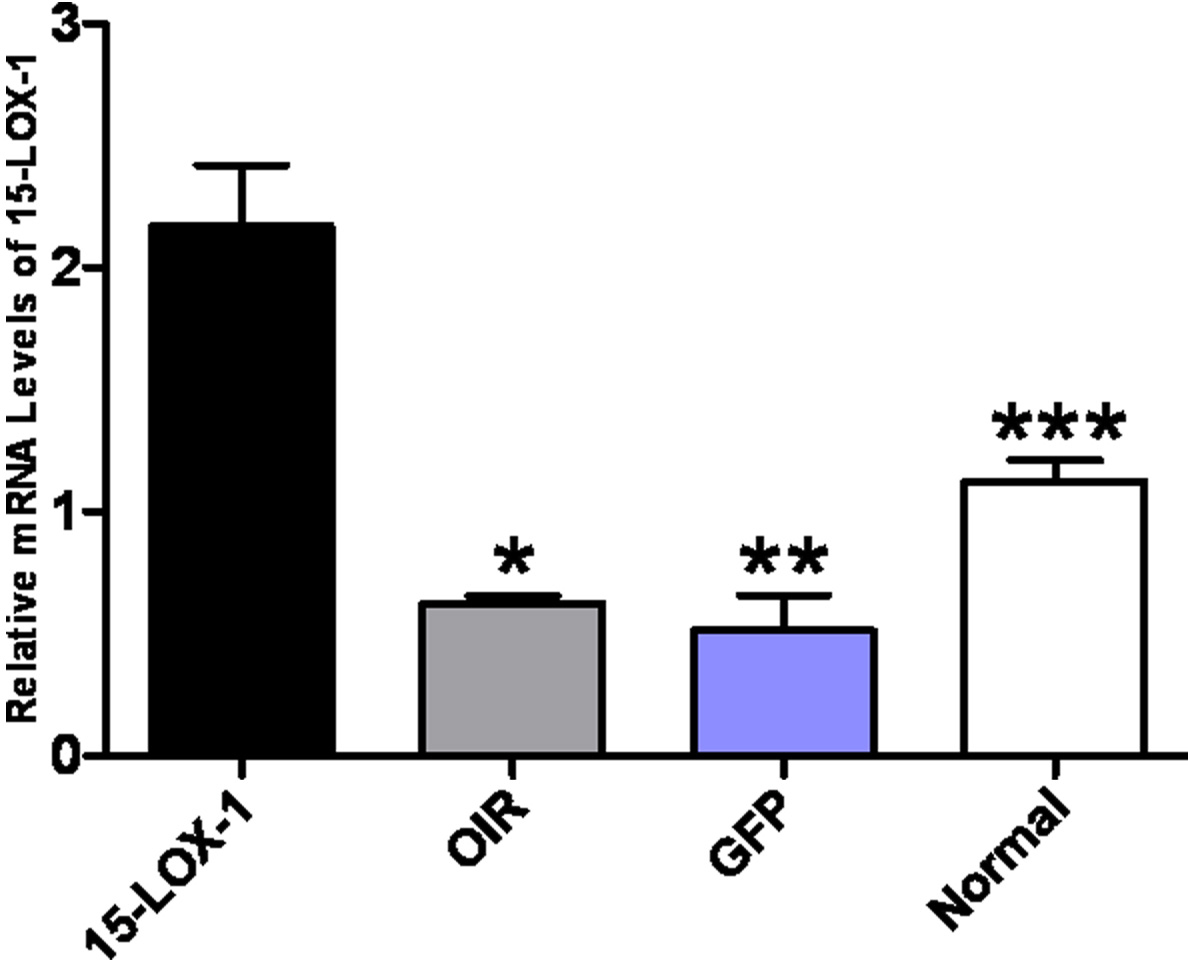
 Figure 4 of
Li, Mol Vis 2012; 18:2847-2859.
Figure 4 of
Li, Mol Vis 2012; 18:2847-2859.