Figure 1. 15-LOX-1 levels in the retina during the development of neovascularization. Western blot analysis of 15-LOX-1: retinas from
four normal group and four oxygen-induced retinopathy (OIR) group mice were dissected at each time point as indicated. A: The same amount of retinal proteins from each mouse was blotted sequentially with the anti-15-LOX-1 and anti-β-actin antibodies.
The blot shows results from normal group (N) and OIR group (R) mice. B: 15-LOX-1 protein relative amounts expression levels in normal group (N) and OIR group (R) mice. The bands were quantified
with densitometry and normalized by β-actin. The levels of 15-LOX-1 protein in the OIR group were decreased compared with
the normal group. Statistical significance was determined with two-way ANOVA (OIR group versus Normal group *p<0.05, n=3).
C: 15-LOX-1 mRNA levels in the retina with neovascularization. The same amounts of total RNA from three normal group and three
OIR group mice retinas at various ages were used for real-time PCR analysis. The levels were normalized with β-actin. The
15-LOX-1 mRNA levels in the OIR group were decreased compared with the normal group. Statistical significance was determined
with two-way ANOVA (OIR group versus Normal group *p<0.05, n=3).
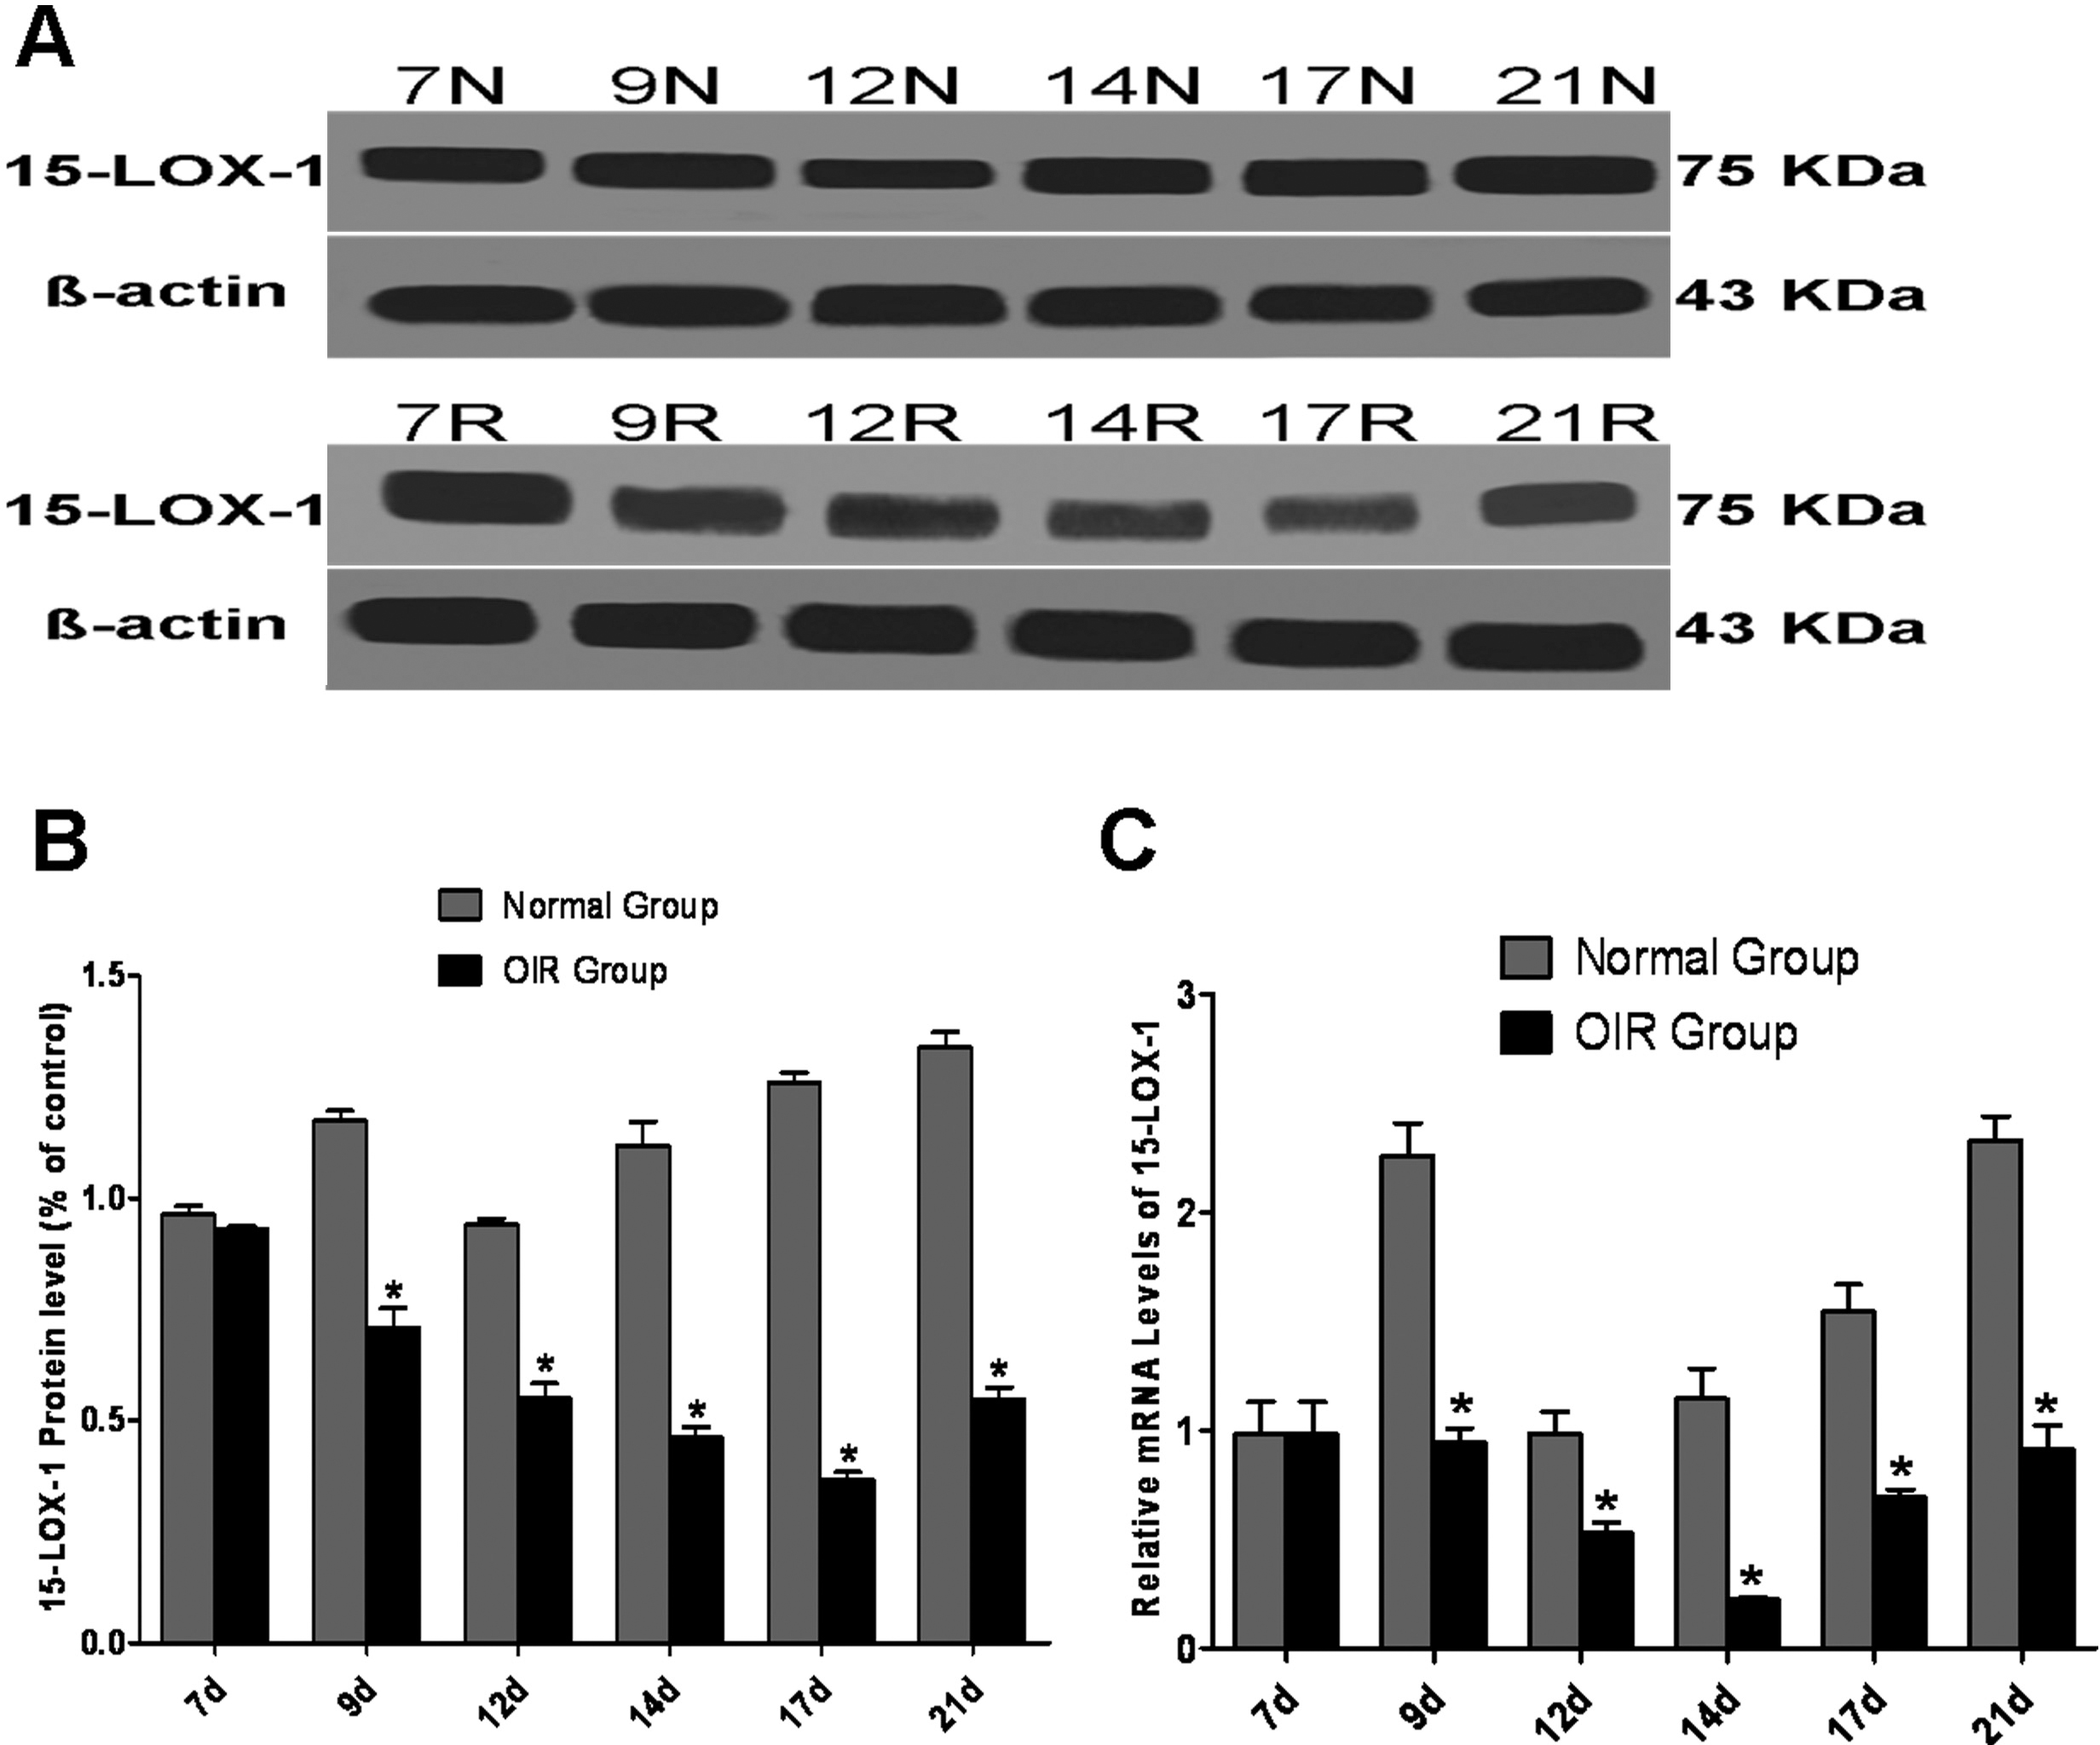
 Figure 1 of
Li, Mol Vis 2012; 18:2847-2859.
Figure 1 of
Li, Mol Vis 2012; 18:2847-2859.