Figure 5. Intravitreal N-methyl-D-aspartic acid injection activates endogenous rescue and stress pathways. A: Shown is the relative expression of Lif, Clc, Edn2, Fgf2, Stat1, Stat3, Gfap, Casp1, and Mcp-1 in retinas of 129S6 wild type mice at 6 h, 24 h, 48 h, and 6 days after injection of N-methyl-D-aspartic acid (NMDA, black
bars) or phosphate buffered saline (PBS, grey bars). Expression after NMDA injection was expressed relative to expression
after PBS injection, which was set to 1 for each time point. Shown are means±SD of n=4-6. *: p<0.05; **: p<0.01; ***: p<0.001.
Two-way ANOVA with Bonferroni post hoc test was used to test statistical significance. B: Levels of proteins and phosphoproteins in total retinal extracts from 129S6 wild type mice were tested by Western Blotting
at 24 h after injection of NMDA or PBS. Shown are protein levels in extracts of two retinas after NMDA and two retinas after
PBS injection as indicated, n=3.
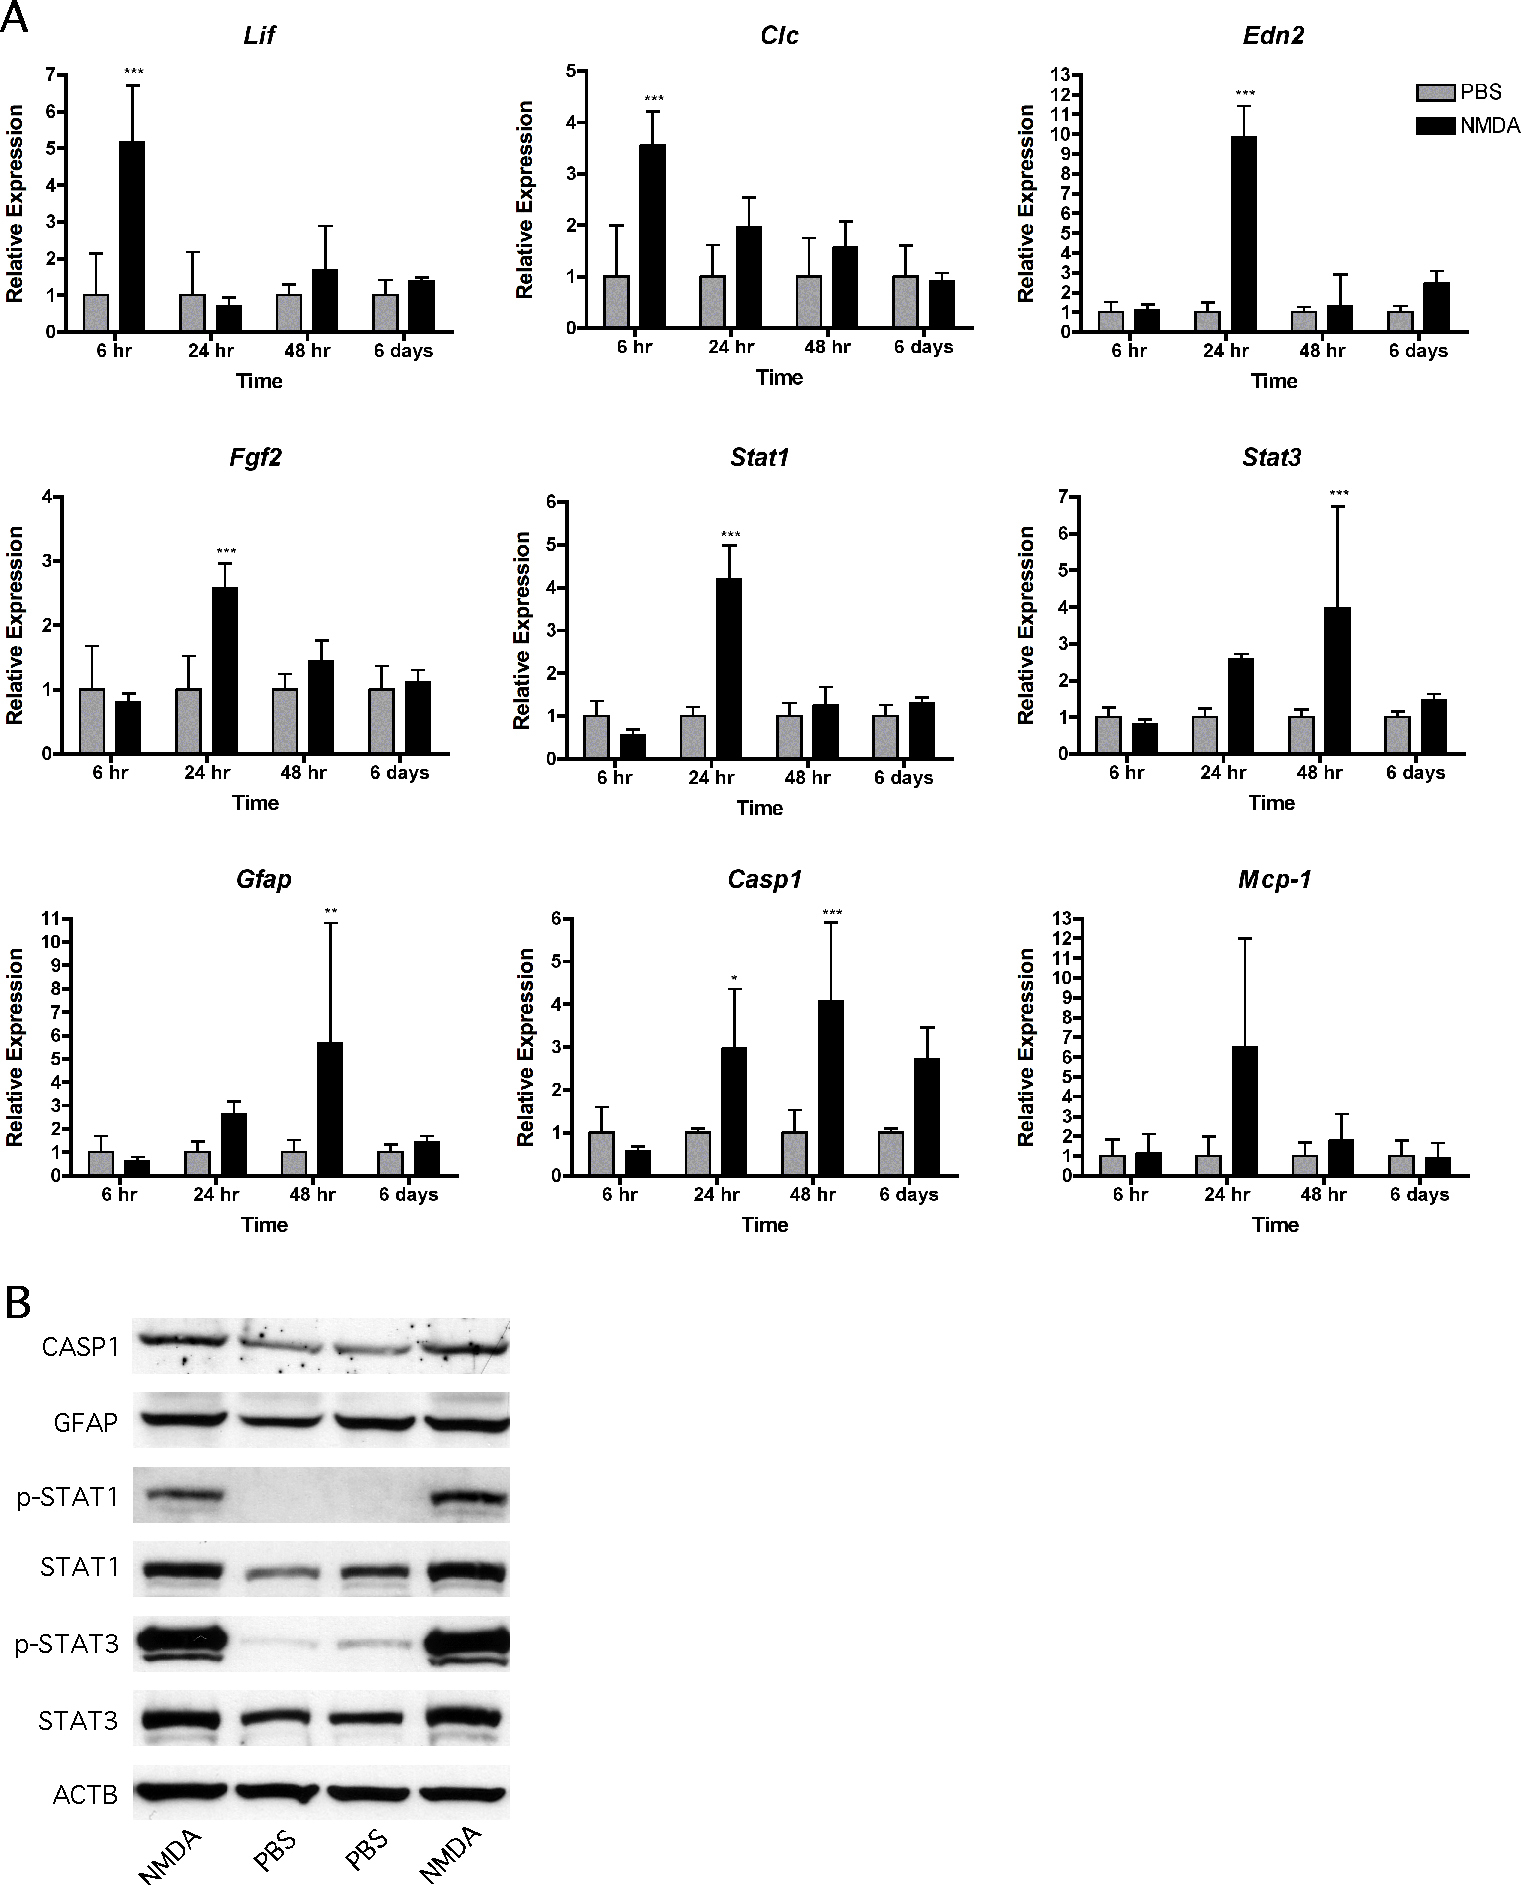
 Figure 5 of
DeParis, Mol Vis 2012; 18:2814-2827.
Figure 5 of
DeParis, Mol Vis 2012; 18:2814-2827.