Figure 3. N-methyl-D-aspartic acid treatment does not reduce survival of OPN4-positive ganglion cells. Shown are representative photomicrographs
taken from retinal flat mounts stained for BRNA3A (yellow) and OPN4 (green) at 6 days after A, C, E, G: N-methyl-D-aspartic acid (NMDA) injection or B, D, F, H: phosphate buffered saline (PBS) injection. A, B: Shown is double labeling for BRN3A and OPN4. C, D: Shown is BRN3A staining. E, F: Shown is OPN4 staining. G, H: Shown are merges of panels C and E, or D and F, respectively, n=3-4. Scale bars are A, B: 100 µm; C-H: 50 µm. I-J: Shown is quantification of I: BRN3A- positive cells and J: OPN4-positive cells in retinal flat mounts at 6 days after NMDA (black bars) or PBS (grey bars) treatment. Shown are means±SD
of n=3-4. *; p<0.05. An unpaired two-tailed Student t test was used to test statistical significance.
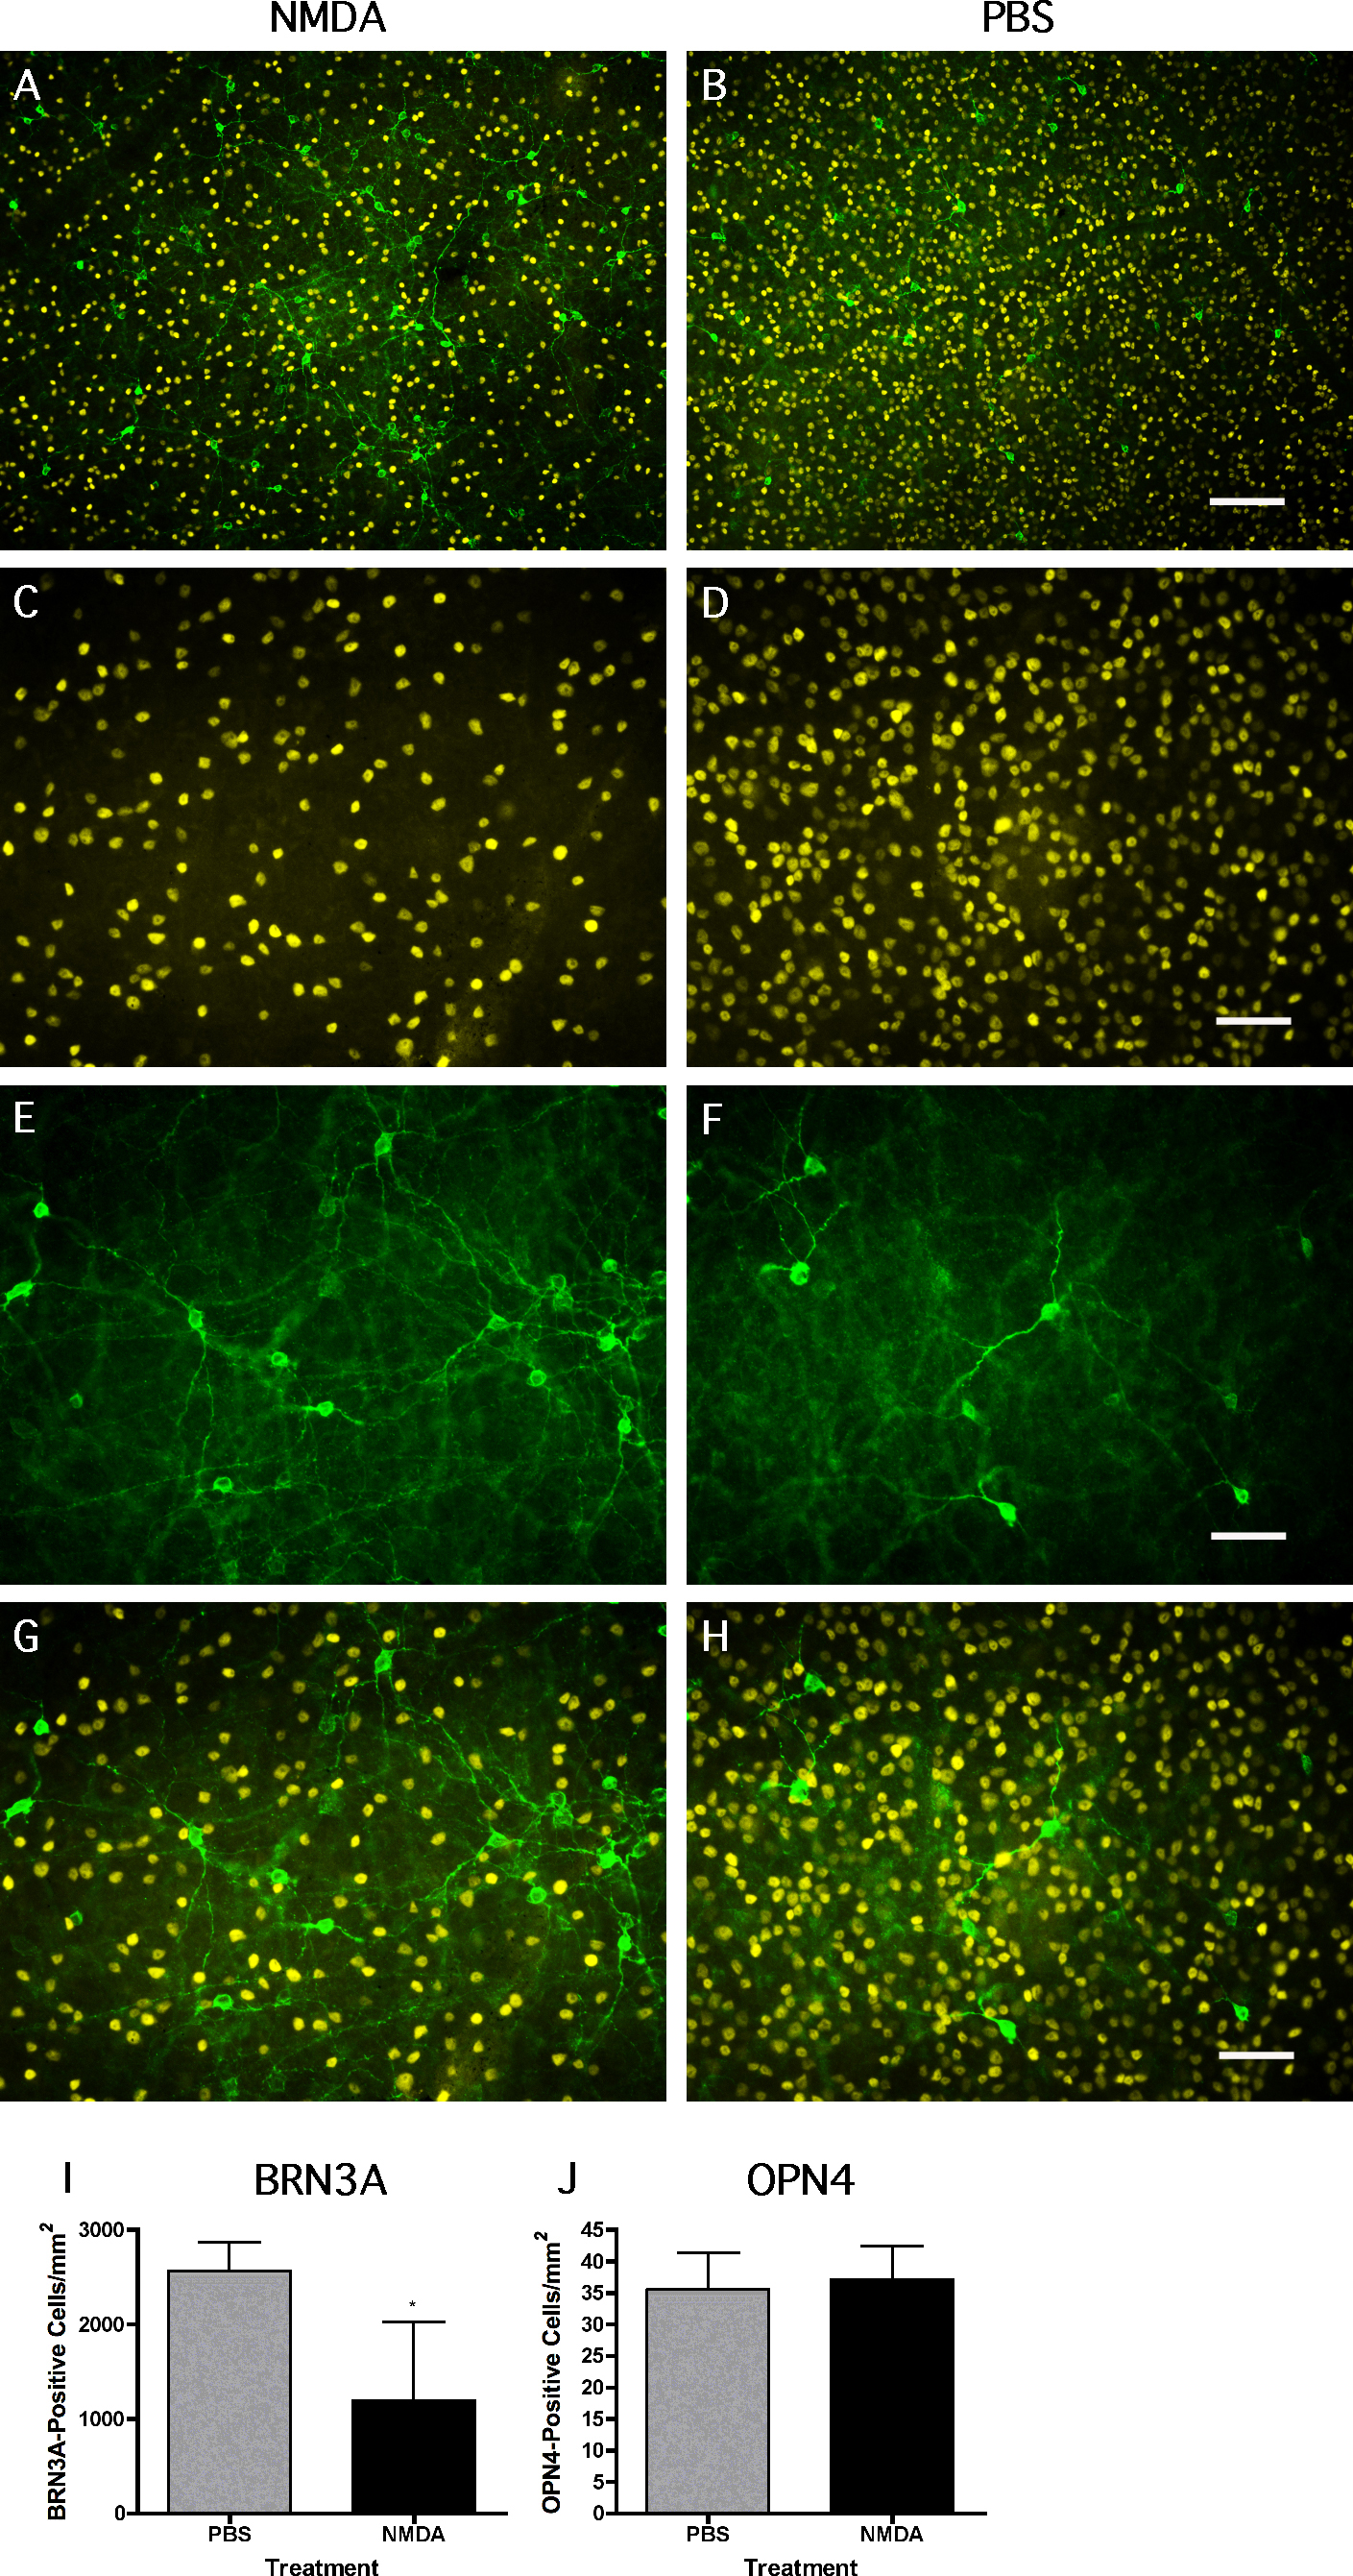
 Figure 3 of
DeParis, Mol Vis 2012; 18:2814-2827.
Figure 3 of
DeParis, Mol Vis 2012; 18:2814-2827.