Figure 3. RB116 cells express stem cell markers. A: RB116 cells were analyzed by immunocytochemistry, compared with Y79 and WERI-RB27 cells, and found to contain subpopulations
of cells that express ABCG2, Nanog, Oct3/4, and ALDH1A1. The (-) control received isotype control antibody instead of primary
antibody. Experiments were repeated 3 times and three groups of 100 cells were counted for each cell type. Error bars indicate
standard deviation. Tukey’s post tests were performed to calculate p values. For ABCG2, WERI-RB27 is greater than RB116 and
Y79 (p<0.001). For Nanog, RB116 is greater than Y79 and WERI-RB27 (p<0.001). For ALDH1A1, WERI-RB27 is greater than Y79 and
(-) control (p<0.001) and RB116 is greater than (-) control (p<0.01). For Oct4, WERI-RB27 is greater than Y79, RB116 and (-)
control (p<0.001) and RB116 is greater than (-) control (p<0.05). B: RB116 cells were analyzed by reverse transcriptase polymerase chain reaction (RT–PCR) and found to express ABCG2, Nanog, Oct3/4, and ALDH1A1. The lanes of the gel are indicated as follows: M=marker, A=ABCG2, n=Nanog, O=Oct3/4, AL=ALDH1A1.
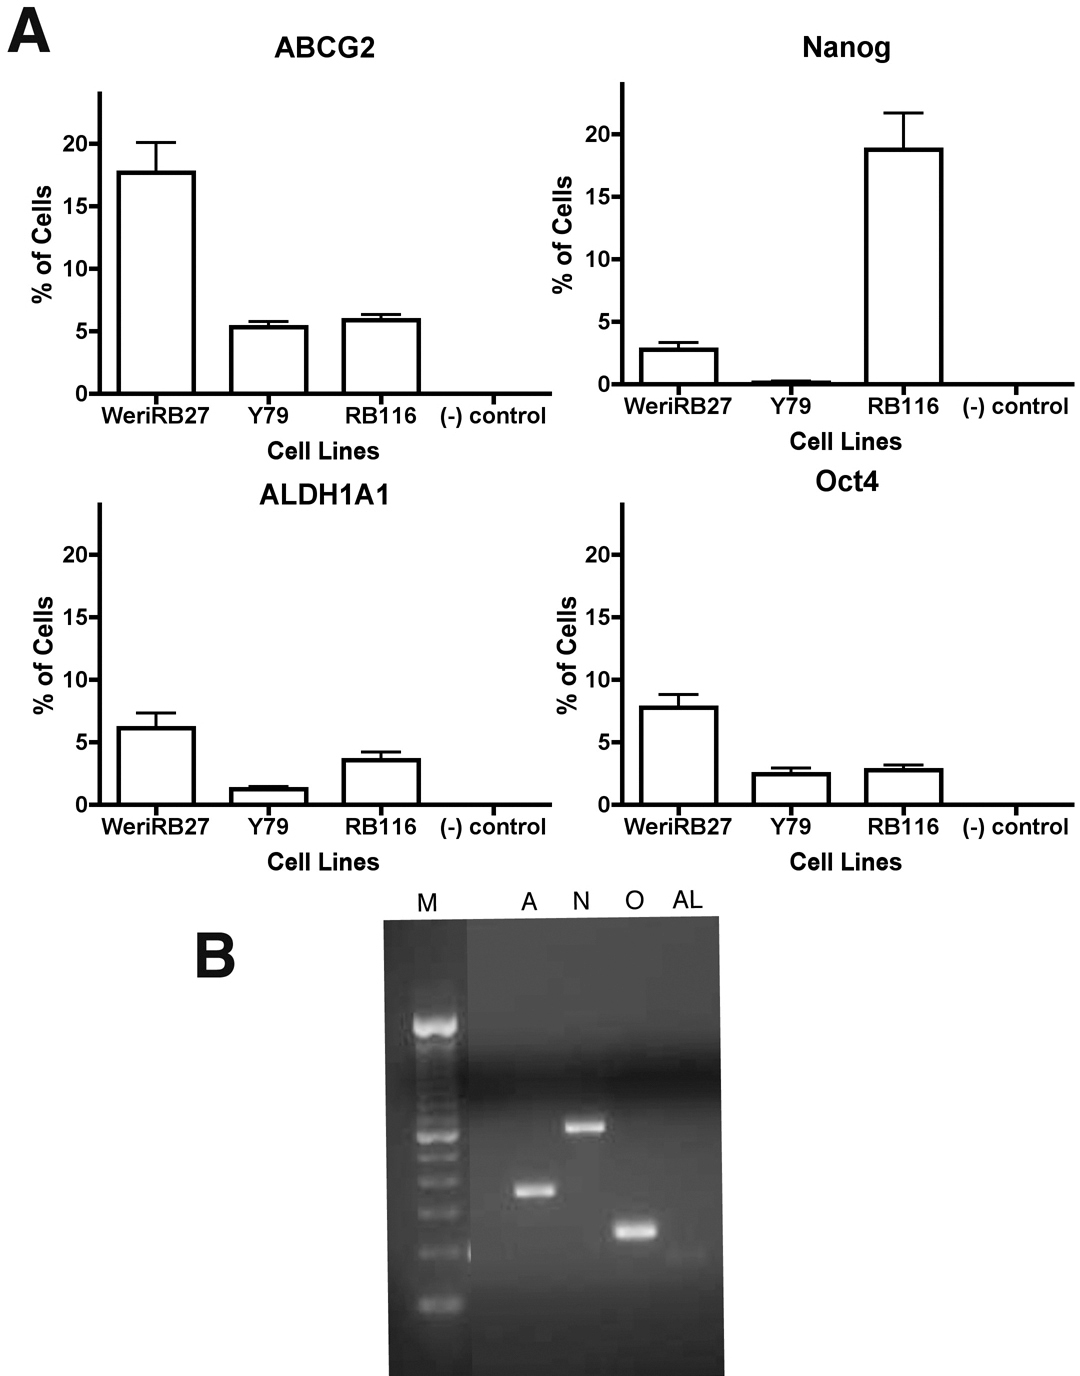
 Figure 3 of
Bejjani, Mol Vis 2012; 18:2805-2813.
Figure 3 of
Bejjani, Mol Vis 2012; 18:2805-2813.